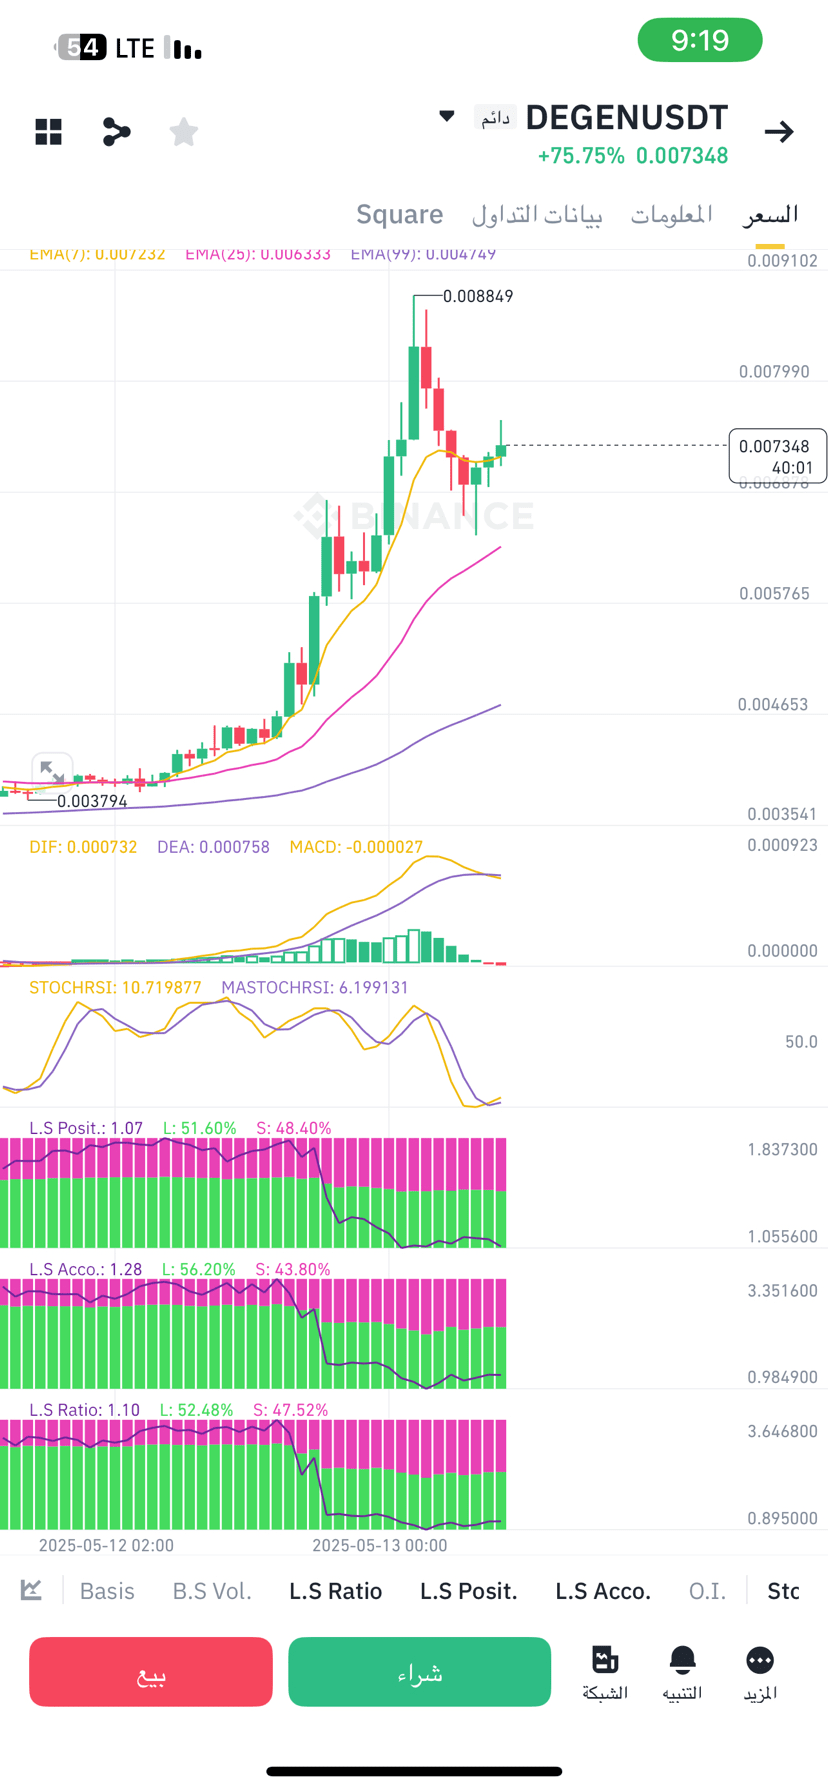
In the image, there are 3 important indicators explaining trader behavior: Are they buying more? Or selling? And is there a clear change we can capitalize on.
Of course, we find it on the 5-minute frames and above in futures or in Arabic, futures contracts.
⸻
1. L.S Posit. = 1.07
What does it mean?
The ratio of open buy trades to sell trades.
• Higher than 1.0 = More buying = Positive
• Less than 1.0 = More selling = Negative
In the image:
• Buying: 51.60%
• Selling: 48.40%
This means the market has a slight inclination towards buying but without strong momentum.
⸻
2. L.S Acco. = 1.28
What does it mean?
The ratio of accounts opening buy trades versus sell trades.
• Higher than 1.0 = More buying traders = Positive
• Less than 1.0 = More selling traders = Negative
In the image:
• 56.20% of accounts are opening buy trades
• 43.80% are opening sell trades
This gives a clearer signal that the overall market sentiment is bullish.
⸻
3. L.S Ratio = 1.10
What does it mean?
The ratio of the volume of money entering buy trades versus sell trades.
• Higher than 1.0 = Money is entering buying = Positive
• Less than 1.0 = Money is entering selling = Negative
In the image:
• 52.48% Buying
• 47.52% Selling
This means liquidity is still leaning towards buying but by a small margin.
⸻
Summary:
• All three indicators above 1.0 = Positive buying signal
• But the differences are small, which does not indicate aggressive entry.
• It's best to monitor any sudden reversal in 'L.S Ratio', as it is the first indicator that gives a warning of a change in direction.
⸻
When are the indicators negative?
• If L.S Posit < 1.0 = Trades are leaning towards selling
• If L.S Acco < 1.0 = Most accounts are opening sell trades
• If L.S Ratio < 1.0 = Liquidity is entering into selling
If they all drop together, the market is on its way down.
Add to it the MACD indicator to have a positive crossover.
And the RSI indicator.
Support me if you find the content useful.


