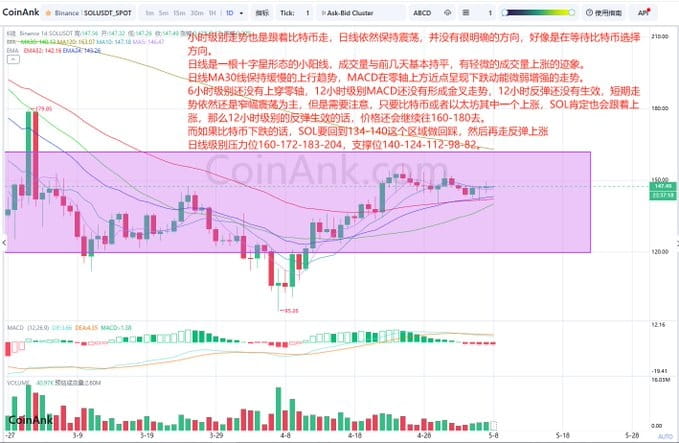
The hourly level trend also follows Bitcoin, the daily line remains volatile without a clear direction, as if waiting for Bitcoin to choose a direction.
The daily line shows a small bullish candlestick with a doji pattern, and the trading volume is basically flat compared to the previous days, with slight signs of an increase in trading volume.
The daily MA30 line maintains a slow upward trend, and the MACD shows a weakly increasing downward momentum near the zero line.
The 6-hour level has not yet crossed above the zero line, the 12-hour MACD has not yet formed a golden cross, the 12-hour rebound has not yet taken effect, and the short-term trend remains mainly narrow fluctuations. However, it is important to note that if either Bitcoin or Ethereum rises, SOL will definitely follow. If the 12-hour rebound takes effect, the price will continue towards 160-180.
If Bitcoin falls, SOL needs to return to the 134-140 area for a retracement before rebounding and rising.
The daily level resistance is at 160-172-183-204, and the support level is at 140-124-112-98-82.
From the liquidation heat map of SOL, it can be seen that
the price is rising, and there are still many large short positions waiting for liquidation in the 148.4-152.8 area.
the price is falling, and there are still many large long positions waiting for liquidation in the 144.2-137.4 area.


