Before we begin, good morning everyone. I wanted to make a brief presentation on how powerful the use of one of the most important institutional tools for technical analysis can be: the Fibonacci Extensions and Retracements. Let's get started!
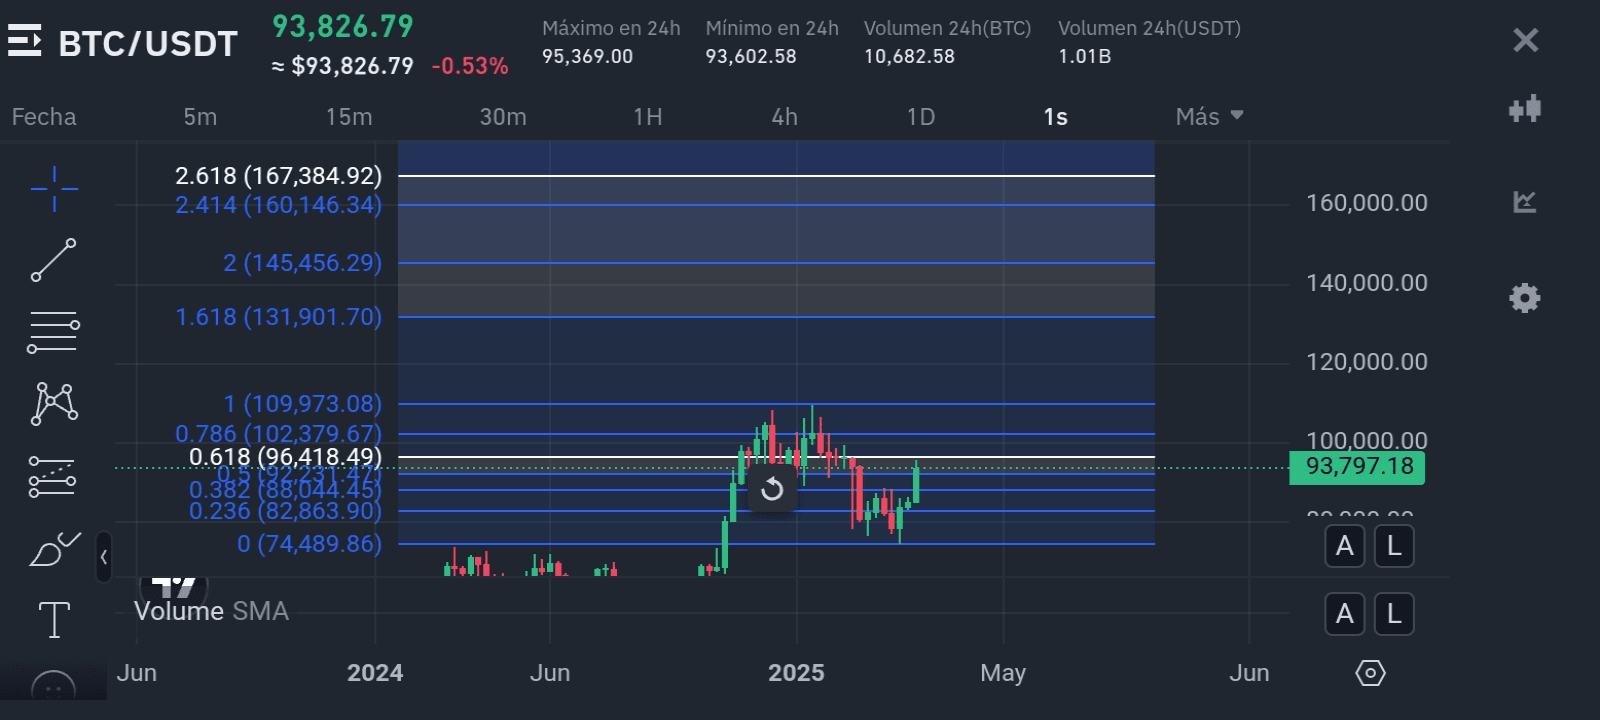
Bitcoin Chart: Weekly Timeframe
1. I will take as an example an analysis of Bitcoin from a previous period. Let us pay attention to the following: if we place ourselves back then, the future price of Bitcoin was still an unknown. However, after drawing the Fibonacci extensions, the price mathematically stopped at the level 2.618 within the 'price discovery zone': at $109,000 ✓. (See chart below)

2. Now let's move on to the current situation (I sound like the news! 😅). If we redraw a Fibonacci, we will notice that the 2.618 level (in the price discovery zone) predicts a price for Bitcoin in 2025: at $167,000 ✓. (See chart below)
How can we make money now?
If Bitcoin can rise another +72%, it's obvious! We must position ourselves in Bitcoin, in serious cryptocurrencies, and wait. This is an important moment; avoid speculative advice on futures, memes, and childish nonsense... 🤡🎈🥳
How Long to Wait?
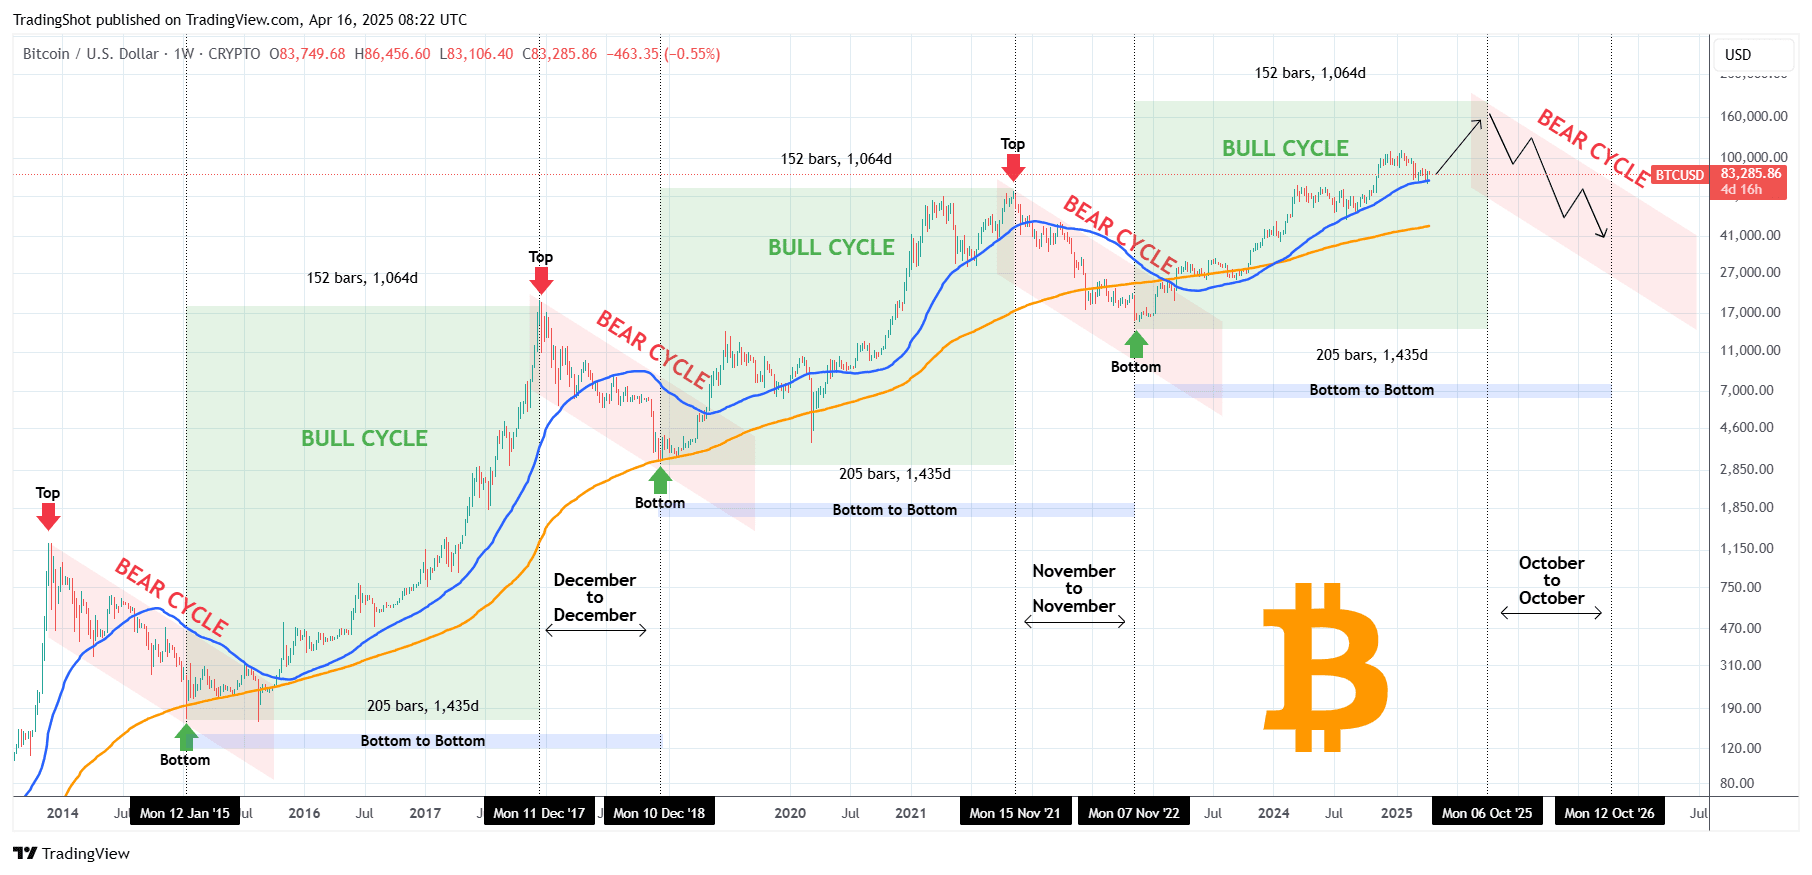
According to the charts (below), everything indicates that in October 2025 the price of Bitcoin should reach its new ATH. You still have time until October to make a good fortune. Don't miss the opportunity that this new market cycle offers you: which can extend from Q4 2025 to early 2026. (Analyze the charts and draw your own conclusions) [◽]
- Without further ado, greetings and good luck with your trades!
Until then… 💰💰💰
