2. How to Analyze Structure (Special Use of Fibonacci)
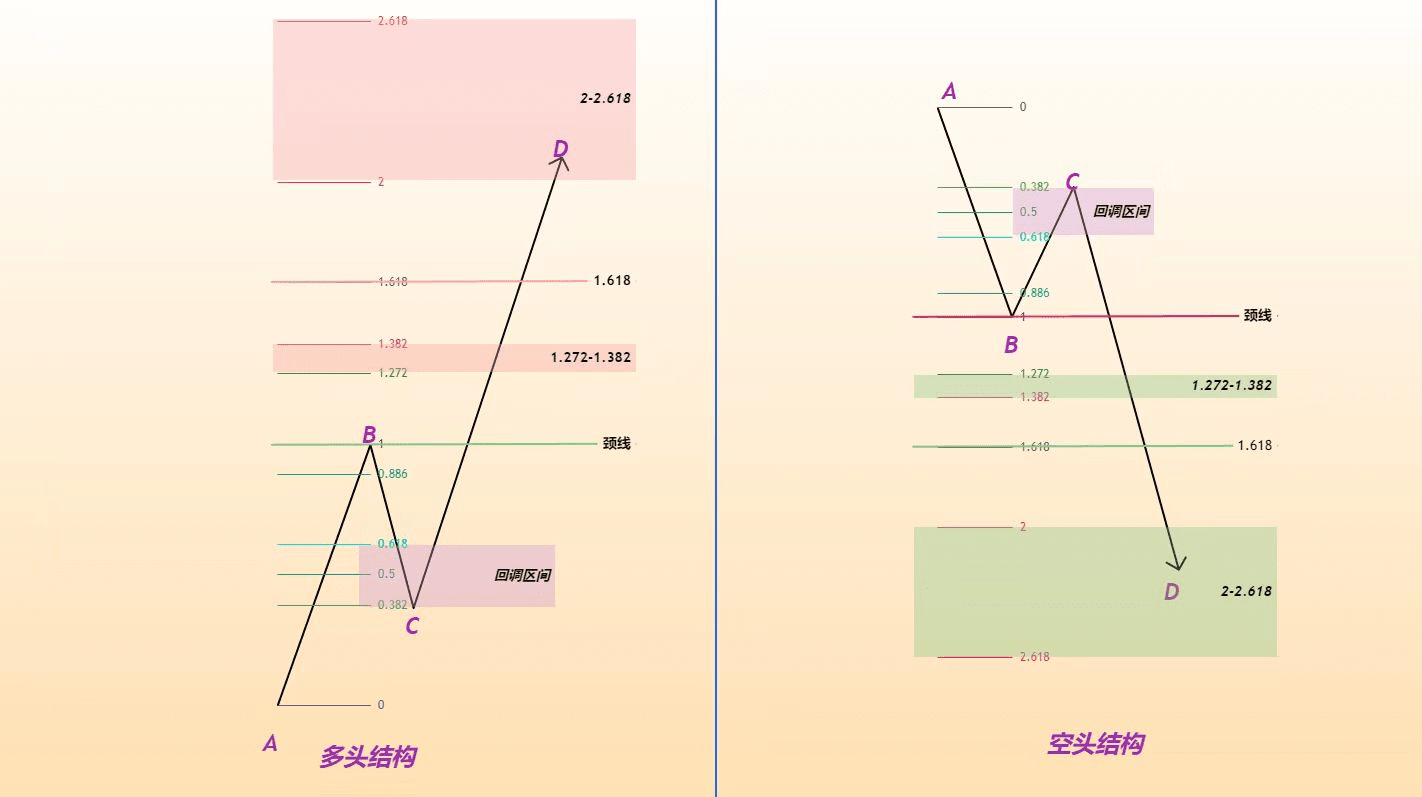
We set the neck line position of point B to 1 and the starting point A to 0. When point C retraces to the 0.382-0.618 purple range and point D breaks through the neck line position, we believe a bullish/bearish structure appears.
Fibonacci Extension 1.272-1.382, 1.618, 2-2.618 is the support/resistance range. When the range is broken, a support-resistance swap occurs (i.e., the support area is broken and becomes the resistance area. The resistance area is broken and becomes the support area). 2-2.618 is the range that this bullish/bearish structure ultimately focuses on; when the range is achieved, we believe this structure has completed.
(Retracement Area: Purple Mark. Support Area: Green Mark. Resistance Area: Red Mark.)