Core Logic:
1. During economic recessions, U.S. stocks (S&P 500) typically decline, but they do not always fall continuously.
2. Historical data shows that a 20% drop is a relatively safe entry signal (in extreme cases, it could drop another 20%-30%), but risk must be controlled to avoid one-time all-in.
Step 1: Set Key Levels
Current S&P 500 Level (Closing Price on April 29, 2025): 5,560 points
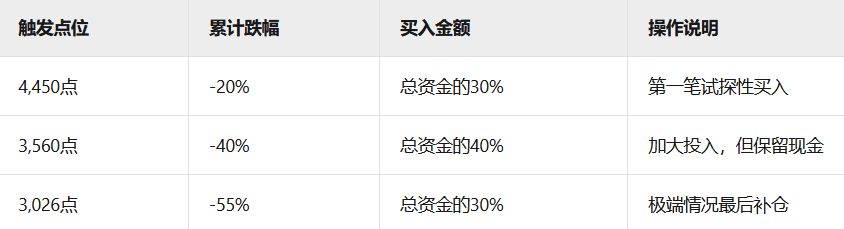
First Bottom Trigger Point:
1. Drop of 20% → 5,560 × (1-20%) = 4,450 points
2. In extreme cases, drop another 20% → 4,450 × (1-20%) = 3,560 points
3. In extreme cases, drop another 15% → 3,560 × (1-15%) = 3,026 points
Note: According to historical data, the maximum drop in 2008 was 57%, but in the last 20 years, extreme drops have mostly been between 30%-40%.
Step 2: Buy in Batches to Reduce Risk
Step 3: Key Indicators to Assist Decision-Making
1. Valuation Signal:
The price-to-earnings ratio (PE) of the S&P 500 becomes safer when it drops to 18-20 times (PE was 25.19 times in April 2025).
2. Sentiment Indicator:
The fear index (VIX) rising above 40 and then falling back may indicate that the bottom is near.
3. Policy Signal:
The Federal Reserve starts to cut interest rates, or there is a easing of U.S.-China tariff policies.
Step 4: Risk Control
1. Maximum Loss Limit Per Trade:
After each purchase, if it continues to drop by 10%, consider stopping loss on part of the position (e.g., reduce holdings by half).
2. Total Loss Bottom Line:
If it drops another 20% after full investment, assess whether to continue holding (to avoid being 'deeply stuck').
Step 5: The Specificity of Bottom Fishing Bitcoin
Correlation: Bitcoin's correlation with U.S. stocks has increased in recent years, but its volatility is greater.
Recommendation:
After the S&P hits bottom, observe if Bitcoin stabilizes in sync (e.g., if the weekly chart no longer sets new lows).
Buy in batches to avoid one-time investments (e.g., buy Bitcoin every time the S&P falls by 10%).
Historical Case Reference
2020 Pandemic Crash:
The S&P rebounded after falling 34% from its peak to 2,191 points, with bottom-fishers making over 50% profit within six months.
2008 Financial Crisis:
The S&P fell 57% to 666 points, but it took 2 years of patience to break even.
Summary
Simple Mnemonic: "Buy a little when the S&P drops 20%, add more when it drops 40%, and finally gamble when it drops 55%"
Key Actions: Set key levels in advance, buy in batches, and strictly adhere to stop-loss.
(Note: The above strategy is based on historical data and may change due to policies or black swan events, requiring dynamic adjustments.)
