Introduction:
Amid the volatile movements of the cryptocurrency market, Solana (SOL) stands out as one of the digital assets that receives significant attention from investors and analysts. The SOL/USDT pair is one of the important pairs on the Binance platform due to its large liquidity and technical volatility that provides good profit opportunities. In this article, we present an in-depth technical analysis of the current movement of the currency, highlighting entry and exit signals, support and resistances, and general recommendations for traders and investors.
First: Market Overview
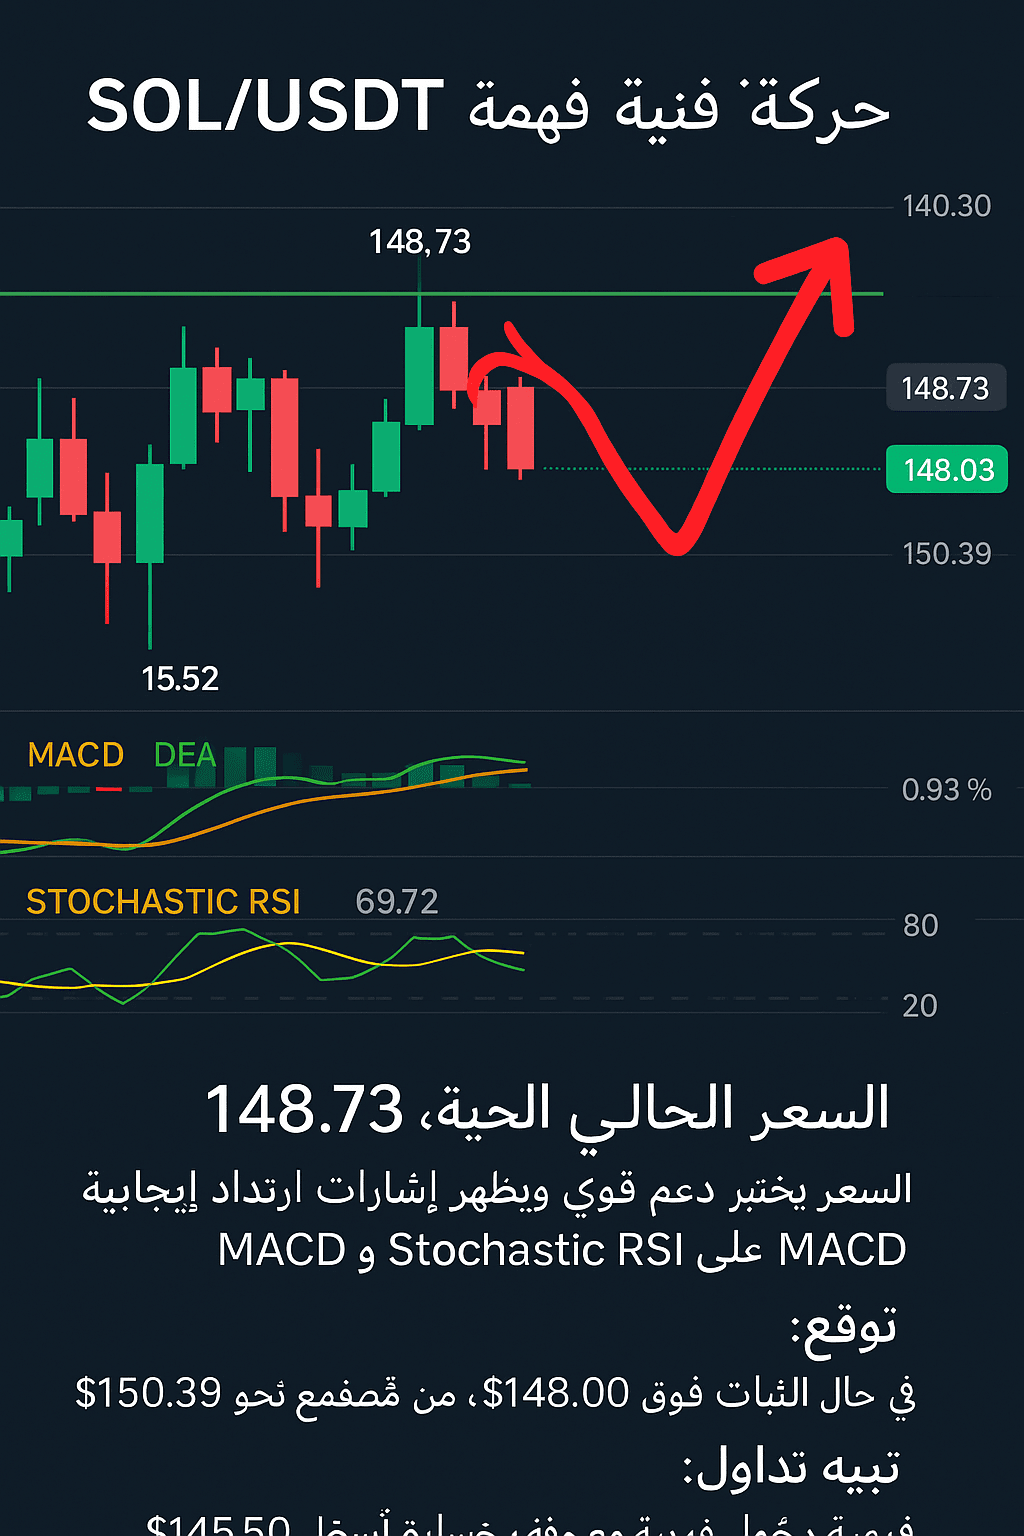
The current price of SOL against USDT is $148.73, and the 1-hour chart shows a strong test of the support area near $145.50. The last peak was recorded at $150.39, reflecting strong resistance in that area. While the market has maintained its trades above support, we noticed the beginning of a potential upward wave.
Secondly: Detailed Technical Analysis 1. Candle Movements:
The recent candles indicate an attempt to rebound after a slight drop, as long candles with lower wicks appeared, reflecting clear buying pressure at support levels.
2. MACD Indicator:
The MACD line crosses above the Signal Line, indicating the beginning of a positive momentum wave.
The green bars are gradually increasing, supporting a bullish outlook in the near term.
3. Stochastic RSI Indicator:
The indicator is at 69.72, which is close to the overbought area.
However, it has not yet entered the danger zone (above 80), which means there is room for further upward movement before a correction occurs.
4. Supports and Resistances:
Main support: $145.55
First resistance: $150.39
If $150.39 is firmly broken, we expect an upward movement towards $152 and then $155.
5. Trading Volumes:
The trading volume in the last 24 hours shows strong market interest, reaching 2.26M SOL, which supports the credibility of the expected move.
Third: Trading Scenarios The bullish scenario:
Entry from current levels or from $147.80
First target: $150.39
Second target: $152.00
Stop loss: $145.50
The bearish scenario (in case of breaking support):
Breaking $145.50 with a 1-hour candle close may open the door to a drop towards $143.00
In this case, it is advisable to exit the trade and wait to reassess the entry.
Fourth: Motivation for Investors
The market does not wait for anyone, and it does not reward the hesitant, but rather those with vision, analysis, and discipline. Opportunities in the cryptocurrency market are many, but timing and discipline are the keys to profit. Always remember that each candle on the chart is a message from the market, so be among those who read it wisely and invest based on data, not emotions.
Invest with confidence, not fear. Observe, assess, enter, and be ready to exit if necessary. Master the art of entering and exiting and do not let your emotions control your decisions.
Fifth: Final Recommendations
Do not enter the trade until the technical signal is confirmed (such as breaking resistance or bouncing from support).
Always set a permanent stop loss on every trade.
Do not risk more than 2% of your capital on a single trade.
Monitor technical indicators comprehensively and do not rely on a single indicator.
Follow the news related to Solana as it directly affects price movement.
Conclusion:
The SOL/USDT pair now shows a technical opportunity that may be fruitful for short-term traders. The technical analysis supports the likelihood of a bullish rebound, but discipline and adherence to the plan remain essential. Make decisions with confidence, and be prepared for profit or learning, as both are gains in the world of financial markets.
#TrumptaxCuts #AirdropFinderGuide #XRPETFs #AbuDhabiStablecoin #BTCRebound $SOL $SUI $TRUMP


