Bitcoin is under selling pressure as it approaches $95,000. Steady buying at lower price levels indicates that the market may consolidate in the short term.
Highlights:
Bitcoin is struggling at $95,000, but there is still a chance for a breakout.
Capital inflows into Bitcoin ETFs do not always signal a price peak.
Some altcoins are showing signs of an early trend reversal.
On April 28, Bitcoin surpassed $95,000, but buyers faced difficulties. Sellers are still defending this price area. A positive signal is that buyers are not losing much advantage, reinforcing the possibility of reaching $100,000.
A net inflow of $3.06 billion into spot Bitcoin ETFs in the U.S. last week indicates a return of demand from institutional investors. An increase in ETF inflows is not always a bearish sign.

Daily cryptocurrency market overview. Source: Coin360
Dan Tapiero predicts that the Fed will find it hard to ignore declining macroeconomic data. He believes that increased market liquidity will push Bitcoin up to $180,000 before the summer of 2026.
So, what are the important price levels for Bitcoin and altcoins? Let's analyze the charts of the top 10 cryptocurrencies.
SPX Analysis
Trend and Forecast
S&P 500 (SPX) is recovering strongly, surpassing the EMA 20 (5,415 points).

Daily chart SPX. Source: Cointelegraph/TradingView
SPX could reach the 50-day SMA (5,623 points), a small resistance level. If broken, the recovery could rise to 5,800 points. Sellers are expected to defend at 5,800 points.
If sellers want to take control, they need to push the price below the EMA 20. SPX could drop to 5,300 points, followed by 5,119 points.
DXY Analysis
Trends and Insights
The US Dollar Index (DXY) fell below 99 on April 21, but sellers could not maintain the pressure.
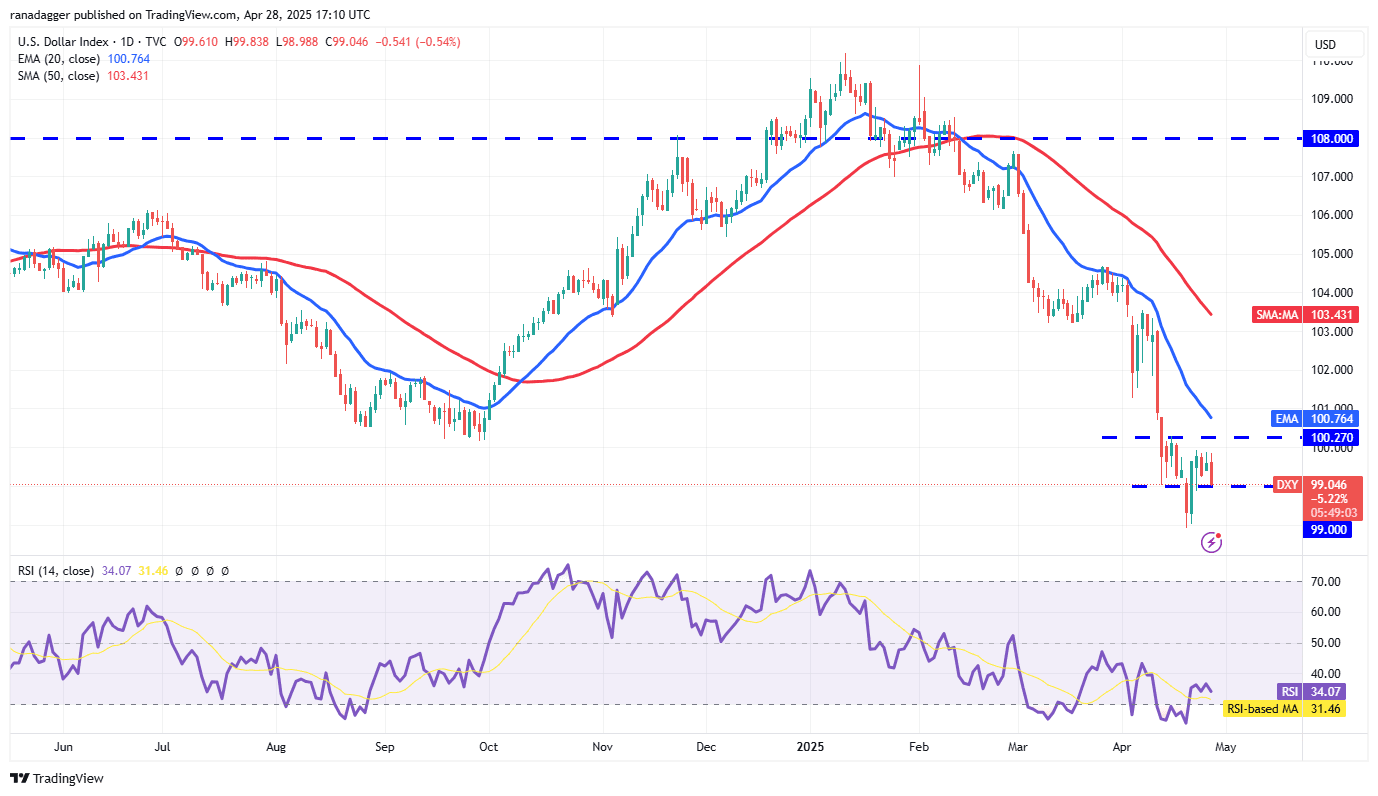
Daily chart DXY. Source: Cointelegraph/TradingView
Sellers have prevented the price from surpassing 100.27. Buying pressure shows signs of exhaustion. The downward sloping moving averages and negative RSI indicate that sellers are dominant. If the price breaks below 99, the DXY could test 97.92.
To ease selling pressure, buyers need to push the price above the EMA 20 ($100.76). If successful, the DXY could rise to the 50-day SMA ($103.43).
Bitcoin (BTC) Analysis
Resistance and Support Areas
Bitcoin continues to face strong resistance at $95,000. Price consolidation near this level increases the likelihood of a breakout.

Daily chart BTC/USDT. Source: Cointelegraph/TradingView
The upward sloping EMA 20 ($89,093) and RSI near the overbought zone suggest that buyers are in control. A candle closing above $95,000 could pave the way to $100,000. Sellers will defend $100,000, but if the price drops, buyers will try to hold at $95,000.
This scenario would be negated if the price drops and breaks below the EMA 20. BTC/USDT could drop to the 50-day SMA ($85,085).
Related: Analysis of the 'Power Law': Will Bitcoin Reach $200,000 by 2025?
Ether (ETH) Analysis
Important Price Levels
Ether closed above SMA 50 ($1,792) on April 26, but buyers could not maintain the momentum.

Daily chart ETH/USDT. Source: Cointelegraph/TradingView
The EMA 20 ($1,719) is an important support level. If the price bounces from the EMA 20, buyers will push ETH/USDT to the previous breakout level of $2,111. Sellers are expected to defend $2,111, as surpassing this level could push ETH to $2,550.
If the price breaks and closes below the EMA 20, sellers remain in control. ETH/USDT could drop to $1,537.
XRP Analysis
Signals and Predictions
XRP bounced from the EMA 20 ($2.15) on April 27, indicating a more positive market sentiment.

Daily chart XRP/USDT. Source: Cointelegraph/TradingView
XRP/USDT could approach the resistance line of the descending price channel. A break and close above this resistance will signal a potential trend change. At that time, this pair could increase towards a target of $3.
If the price drops from the resistance level and breaks below the moving averages, sellers are defending this level. XRP/USDT may fluctuate within the price range bounded by the resistance line and the support level of $2 in the coming days.
BNB Analysis
Momentum and Outlook
Buyers are trying to keep the price of BNB above the moving averages, but are struggling to create a sufficiently strong rebound.

Daily chart BNB/USDT. Source: Cointelegraph/TradingView
The EMA 20 is flat (around $597) and the RSI is just above 50, showing no clear advantage. To regain an edge, buyers need to push the price above $620. Success at this level could open up an opportunity for a price increase to $644 and then to $680.
A break and close below the moving averages will reinforce the sellers' position. BNB/USDT could drop to $576 and further to $566, where buying pressure is expected to re-emerge.
Related: BNB Chain Accelerates Growth in Q1 2025: Lending, Stablecoin, and Optimized Tokenomics
Solana (SOL) Analysis
Bullish Trend
Solana is facing resistance in the range of $148 to $153. However, a positive sign is that buyers are still persistent.

Daily chart SOL/USDT. Source: Cointelegraph/TradingView
The upward sloping EMA 20 ($139) and the RSI in the positive zone indicate that the dominant trend remains bullish. A successful break and close above $153 would pave the way for a price increase towards the target of $180.
To weaken the current uptrend, sellers need to push the price below the 20-day EMA. If this happens, the SOL/USDT pair could drop to the 50-day SMA ($130), indicating the possibility of forming a sideways phase in the near future.
Related: DeFi Development Unveils Bold Plan: Raising $1 Billion to Accumulate Solana (SOL), Following in MicroStrategy's Footsteps
Dogecoin (DOGE) Analysis
Narrow Range
Dogecoin (DOGE) has corrected down to the moving average area, signaling that the narrow trading range phase may continue.

Daily chart DOGE/USDT. Source: Cointelegraph/TradingView
If the price strongly rebounds from the moving average area, buyers will try to push the DOGE/USDT pair above the resistance level of $0.21. If successful, this pair will complete a double bottom pattern, with a potential price target of $0.28.
Conversely, if the price turns down from $0.21, it indicates that this pair may continue to oscillate within the current range. Sellers will regain an advantage if they push the price below the important support level of $0.14.
Cardano (ADA) Analysis
Positive Buying Pressure
Cardano (ADA) still maintains its position above the moving averages, indicating that buying pressure remains active whenever the price adjusts downwards.

Daily chart ADA/USDT. Source: Cointelegraph/TradingView
The moving averages are approaching a golden cross formation, and the RSI is in the positive zone, giving a slight advantage to buyers. There is a small resistance level at $0.75, but if this level is conquered, the ADA/USDT pair could rise to the $0.83 area.
The first sign of weakness would be the price breaking and closing below the moving averages. This indicates that sellers are still in control and are selling during price increases. At that time, this pair could drop to the level of $0.58, which is a potential support area.
Sui (SUI) Analysis
Buying Pressure
Sui (SUI) has maintained trading just below the resistance level of $3.90, indicating that buyers are maintaining pressure in this price area.

Daily chart SUI/USDT. Source: Cointelegraph/TradingView
This increases the likelihood that the price will break above this resistance level. If this scenario occurs, the SUI/USDT pair could start the next bullish phase, targeting $4.25 and further to $5.
Conversely, if the price turns down from the resistance area and breaks below the level of $3.35, it signals that buyers are taking profits. This move could pull the price down to the Fibonacci retracement level of 38.2% at $3.14 and then to the 20-day EMA ($2.77), which is an area likely to attract buying pressure back.$BTC