Ethereum's price structure continues to follow a familiar macro range between $1,400 and $3,900, with frequent reactions at key support and resistance levels. Momentum faded after failing to surpass $3,600, highlighting the weakness of the uptrend.
ETH price is losing its bullish structure near resistance.
Ethereum price has been trading between a key resistance level at $3,904 and support near $1,400 since early 2022. The structure shows two clear rejections from above this range, the most recent of which occurred in early 2024.
Rekt Capital, a widely followed cryptocurrency market analyst, closely monitored Ethereum's monthly structure and recent breakdown dynamics. It identified $3,904 as a long-term resistance area, where the price faced persistent rejection. Several monthly wicks failed to break above this level, forming a clear double top in early 2024.

With volatility dominating the timeframe, move on to analyzing short-term support structures and downtrend invalidation points. By mid-2024, the price reversed from $3,600 and closed below $2,196. This candlestick broke below the previous support level, forming the basis for a downward reversal.
Following confirmation of the breakdown, Ethereum returned to the light blue demand zone between $1,400 and $2,000. The price briefly dropped below this zone before recovering within the month. The timeframe now shows Ethereum holding near the center of this support zone.
Based on the exponential moving average (EMA) alignment, gauge the strength of the momentum and note the lack of confirmation of a bullish reversal. The orange circle indicates a failed retest attempt for Ethereum, reinforcing the current bearish tone through technical signals.
Looking at the Fibonacci range, he reassessed key retracement zones and identified the $1,400 level as crucial support. Below this level, the green demand zone between $800 and $1,400 remains the next key technical base for Ethereum, supported by a broader market structure.
Ethereum's dominance retests historical support
Ethereum's dominance has been declining since 2022, reversing gains from its previous bull run and testing a support zone that has held for years. Market analyst Reckitt Capital provided another detailed technical analysis of Ethereum's dominance performance. He noted that the green zone between 6% and 8% has historically served as a reversal zone. In 2020, this level represented the bottom of a macroeconomic cycle before dominance surged.
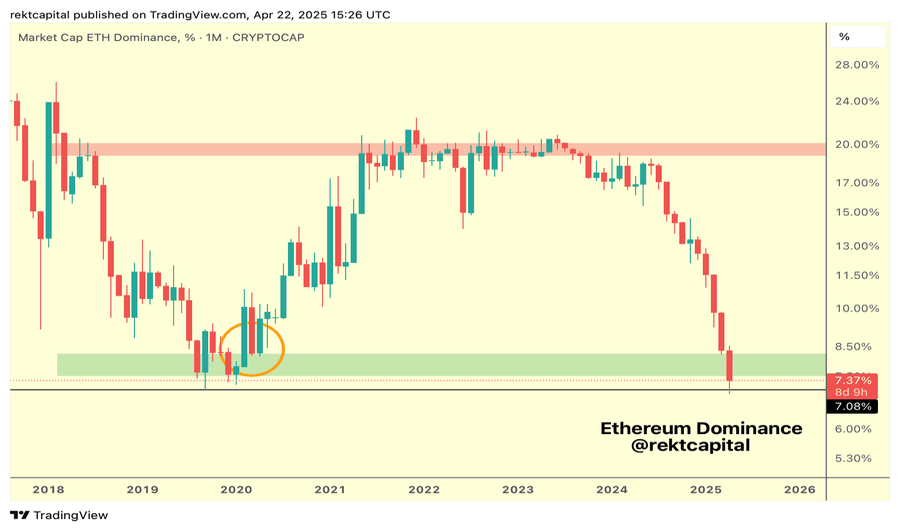
After spotting early weakness in the higher timeframe structure, explore the possibility of a decline near the lower bound of this green zone. The dominance ratio currently stands at 7.37%, with a recent low of 7.08%. This places Ethereum close to its 2019 support level.
Following the Ichimoku Cloud's behavior, he explained that the trend bias remains bearish unless a close above 8% confirms renewed strength. There are no bullish engulfing or hammer formations yet. Resistance remains limited to the 20-21% range, where repeated breakouts have failed. Rect Capital's analysis places Ethereum at critical inflection points in both price and market dominance.
#لا_إله_إلا_أنت_سبحانك_اني_كنت_من_الظالمين
#استغفر_الله_العظيم_وأتوب_إليه