If you have a genuine desire to master trading, you must fully understand that the first step on the path to achieving success in the financial markets is how to correctly read price movements on charts. If you can read what the charts are telling you, the path will be paved for you to master trading. There is a consensus among the greatest trading experts that Japanese candlesticks are the best way to display price movements on charts, due to their ease of presenting market information, the richness, value, and accuracy of this information, as well as the ability to build complete trading strategies based on what is known as Japanese candlestick formations or patterns!
In this article, we will take you on an extensive journey to study Japanese candlesticks from A to Z. We will start with a definition of this unique system along with a brief overview of its history, and we will explain how to read Japanese candlestick patterns, and then we will take a look at more than 20 of the most important and common Japanese candlestick patterns.
First... How do the shapes of these candles look? Everyone surely knows they are not illuminating candles, but they are candles of signals.

Second: How to read and interpret Japanese candlesticks
Japanese Candlestick is one of the systems or methods of displaying price movements on charts, and through it, we can read all the data related to each trading session, on any time frame, whether small or large. This means we can read the opening price, closing price, highest price, and lowest price at a glance from Japanese candlestick charts.
The credit for the invention of this type of chart goes to a Japanese rice trader named Munehisa Homma in the 18th century, and Japanese candlesticks soon became popular among market traders in Japan.
It then moved to Western Europe through market expert Steve Nison in the 1990s. Since then, Japanese candlesticks have become the fundamental approach to reading and analyzing price movements in various financial markets.
Third: The struggle between bulls and bears as depicted by Japanese candlesticks.
There are rising bulls and falling bears. I will show you some shapes of candles and what they symbolize.
There are 6 types of candles that are followed by a significant rise and a significant decline.
The first type is the Doji candle.
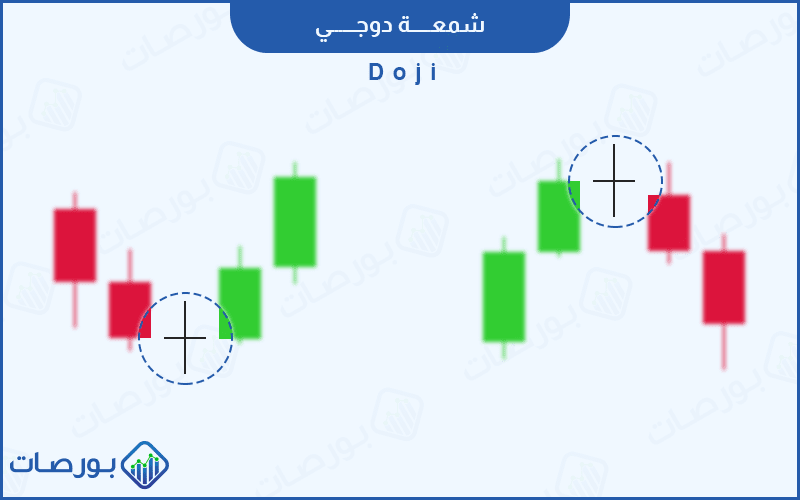
This candle, if it appears in this shape, is followed by a candle with double height.
If it appears red, it is followed by a significant decline.
The next type of candlesticks is the spinning top candle. If this candle appears...
In this shape, the model in the image below is considered a sign of a significant rise or significant decline. If there was a decline and this candle appears, it is followed by a rise. And if there was a significant rise and it is followed by that candle, the opposite happens. The important thing is that it was preceded by an opposite movement.

We will stop here and continue with you in another article. We hope you like and follow. Leave a comment with your question and we will respond to you.
In the safety of God.