Trade parameters:
• Start of the grid: 151.58 USDT (market entry)
• Range: 145 – 187 USDT
• Number of grids: 17
• Mode: Arithmetic
• Size of one order: ~0.035 SOL
• Stop-loss: 130 USDT
• Take-profit: 190 USDT
• Profit on the grid: 1.13–1.5%
Why did you do this:
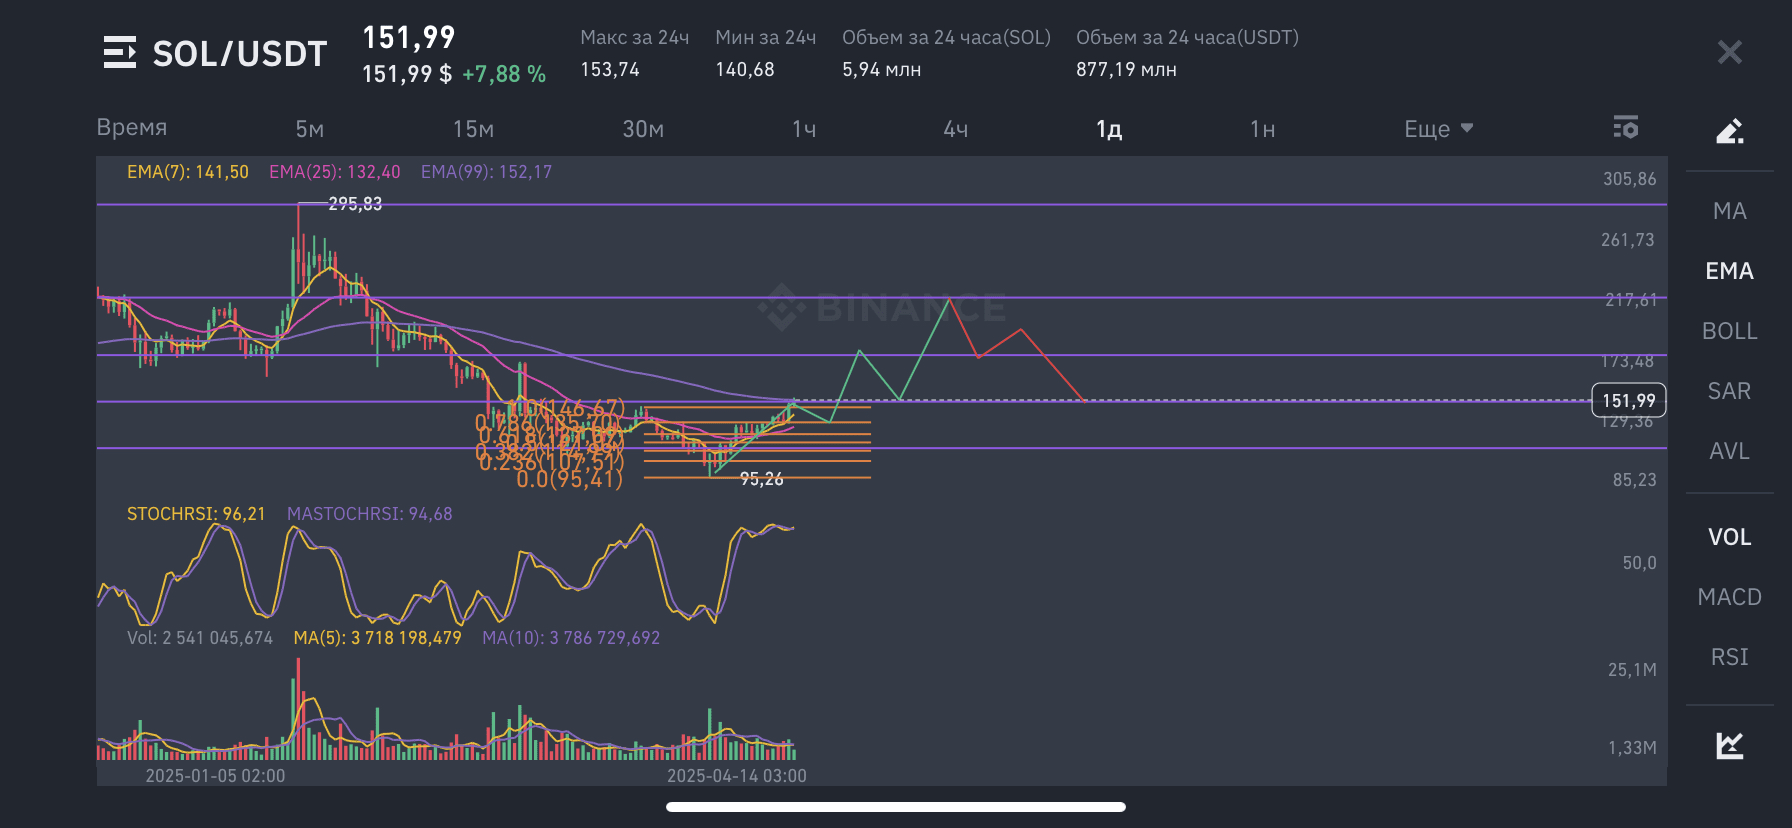
1. Technical consolidation zone and breakout upwards. The chart shows accumulation formation around 95–150 USDT, after which the price began a confident upward movement. The level of 151–152 is broken, which could be the starting point for an upward impulse.
2. EMA signals: EMA(7), EMA(25), EMA(99) indicate a potential trend reversal upwards. EMA(7) crosses EMA(25) from bottom to top, which is a bullish signal.
3. Stoch RSI in the overbought zone (96+), indicating a potential correction, but also confirming the strength of the momentum.
4. Projected scenario: The chart shows a trajectory: rise to the zone of 170–175, pullback and continuation of the rise (possibly up to 190), then a drop. This fully aligns with your take-profit and grid strategy — you plan to catch volatility up and down within the range.
Withdrawal:
You entered at the moment of breaking the resistance level (151–152), expecting movement to the next resistance zone (173–190). The grid bot is selected to extract profit from volatility without exceeding the main range. The trade is balanced: risk is limited (stop-loss 130), profit potential in the zone up to 190.
#MarketRebound $ETH -What would you do?

