It has been almost half a month since the last update, and I am finally releasing version 4.0. In fact, I already published it for my brothers last week, but I delayed the public announcement for a few days to ensure the model's completeness. To accommodate new fans, I will detail the complete version here; new and modified features will also be included in the article. Friends who already understand the previous version can skip the earlier parts. I would like to express my gratitude to all new and old fans for their support!
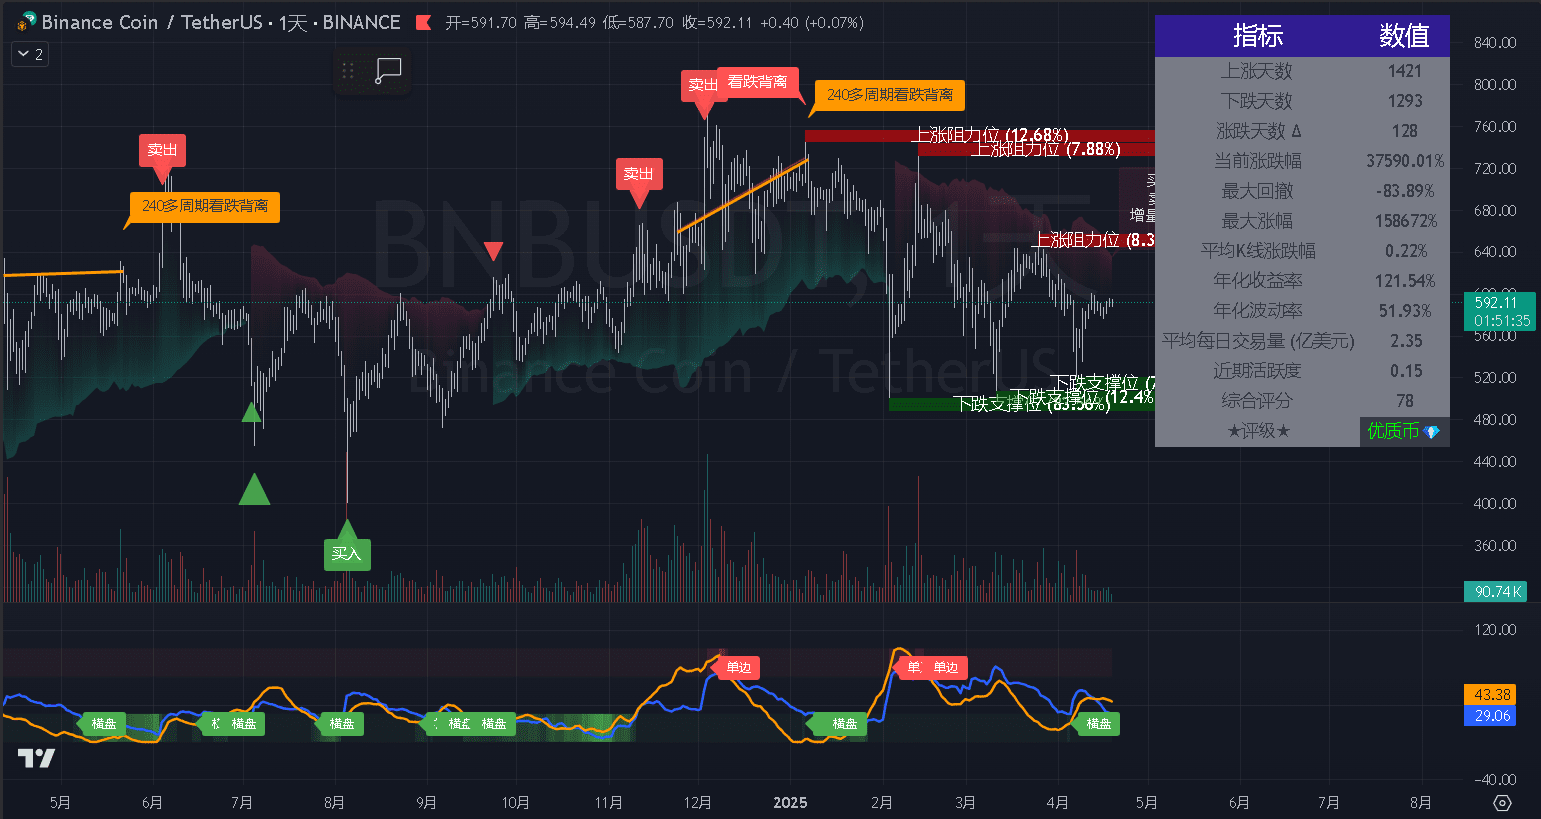
Let me briefly explain the basic framework of my indicator model. First, the model is built on the free charting software TradingView, mainly consisting of six important trading segments (the 3.0 version originally had five). Here, I will use the BNB daily candlestick chart as a demonstration:
Feature Introduction
The first part is liquidity order analysis, which automatically determines potential resistance and support levels in the current market by detecting buyer and seller liquidity and trading volume. This helps traders identify suitable buying and selling opportunities. Moreover, the same period can have different liquidity lengths set; the longer you set it, the fewer pressure levels the model will feedback to you, but generally with stronger support. This supports four options: short-term, mid-term, long-term, or custom (based on your own needs). The pressure level can display the trading volume and percentage in the current price range, with a higher percentage indicating stronger support or resistance, providing a more intuitive understanding of market liquidity distribution.
Moreover, the model supports viewing two different time frames within one cycle, meaning it can display data from two different periods simultaneously on one chart. You can customize this based on your needs, such as viewing 15 minutes together with 1-hour levels (suitable for short to mid-term) or 4 hours together with daily levels (suitable for mid to long-term).
There is a switch for historical data that can be adjusted. If turned on, it can be retained for reference, with newer data being more effective. If it looks cluttered, you can choose to hide it, which will only display the currently valid real-time resistance levels.
Additionally, it supports customizable box styles for resistance levels, market digestion methods, font sizes, and many more details.

The second part is precise real-time buy and sell signals. The model combines multiple market technical indicators for analysis, referencing EMA (Exponential Moving Average), RSI (Relative Strength Index), and ATR (Average True Range), and then rigorously screens opportunities through a triple verification process, ultimately providing suitable buy and sell points.
The model supports two sets of parameter configurations, one defined as low frequency (shown as a large triangle in the image) and another defined as high frequency (also shown as a large triangle). Friends can choose to view either one or combine them for operation (dual signal displays for buying and selling). Regarding signal frequency, the intervals between signals can also be adjusted to avoid excessive displays in a one-sided market.
All provided buy and sell points are strictly calculated and screened, mostly relative to tops or bottoms, with a low frequency but a considerable win rate.
These opening signals can not only be used for entry points. If you already have positions, they can also be used as reference for take-profit and stop-loss levels, improving overall trading efficiency.
Similarly, for those who have been following me for a while, you might know that my previous version had a dynamic take-profit and stop-loss channel. However, after practical testing, I personally believe that the design is not yet mature, so I have temporarily removed this feature in the new version. I plan to reconsider adding the optimized content back in version 5.0 once it is more refined, so stay tuned.

The third part is the overall trend structure. The model references multiple indicators such as VIDYA (Variable Dynamic Index Average), Pivot Points (Support and Resistance Points), ATR, and Supertrend to assess the current overall trend type of the market, whether it is an uptrend, downtrend, or sideways trend is clear at a glance.
The model will implement dynamic ATR adjustments based on the current market volatility standard deviation (lower volatility adopts a lower period ATR, while higher volatility adopts a higher period), ensuring the model aligns more closely with the actual needs of each market phase. Currently, three periods are supported (which can also be freely adjusted).
Trend calculation consists of two parts: one based on Supertrend and the other on VIDYA and Pivot. Friends can refer to either one or observe both to clarify the current market trend.
Additionally, this part can display real-time trading volume buy and sell data, incremental percentage comparisons (these two data points will reset and start recalculating after each VIDYA trend reversal), and the RSI index, helping to better understand the current real-time bullish and bearish power comparison.
Additionally, there is a visual representation of the start of the VIDYA trend, represented by the red and green inverted triangles in the image and the shadow gradient effect, making the market trend more intuitive.

The fourth part is the newly added feature in this version: MACD divergence analysis. This indicator mainly shows the movement of price in the opposite direction to the MACD indicator. Its underlying principle is that whenever the price hits a new low but the MACD does not reach a new low, it indicates a potential bottom reversal, which I call bullish divergence. The opposite direction is similar, known as bearish divergence.
The model detects MACD and automatically draws lines at divergence points while tagging the corresponding divergence labels. You can open the MACD indicator for comparison; it is quite easy to observe and straightforward.
Like liquidity orders, it also supports confirmation across multiple periods, meaning you can view two different time levels on one chart simultaneously by customizing the desired time periods in the settings.

The fifth part is a separate model, volatility and trend strength, which also consists of two structures. The blue line represents the volatility indicator, derived from basic calculation periods, ATR calculation periods, historical volatility periods, oscillation index periods, and Bollinger Band multiples, standardized to an index from 0 to 100, for digital analysis, and finally plotted as a linear indicator for easier visual display.
Next is the orange line, based on standardized ADX periods, with a similar principle, also a scoring system from 0 to 100.
Finally, it will combine two parts to form high volatility and low volatility areas, also supporting customizable effect charts, displaying one-sided or sideways labels, very straightforward, helping to assess the current market trend strength and its risks.

Lastly, the final part is currency screening assistance, which is different from the previous indicators. The first five parts are aimed at short-term analysis tools, while this one is for ultra-long-term assessments, helping to determine whether a cryptocurrency or stock is worth holding long-term.
The principle is as follows: the model automatically calculates the data of the past 4380 candlesticks (4380 = 365 * 12), which covers the past 12 years and three cycles of bull and bear markets. If the total number of candlesticks is insufficient, it will use the maximum available value.
Scores for currencies are obtained from multiple data points, such as the number of up and down days representing major trends, maximum drawdown representing resilience, maximum increase representing explosiveness, average candlestick increase representing long-term performance, annualized returns, and volatility among other criteria, combined to give a digital systematic score, ultimately providing corresponding ratings for currencies, divided into five ratings from top to bottom: top-tier currency, quality currency, average currency, junk currency, and retail investor currency.
Although it may not provide practical effects for short-term speculators, it is definitely a very useful tool for long-term value investors, saving a significant amount of calculation time. Moreover, it is not only suitable for cryptocurrencies but also effective in stocks and other financial markets.

Chart Settings
The overall model style can be controlled in the settings, allowing adjustments to ensure your preferred visual effects, such as trend lines, signals, text, boxes, tables, labels, or drawing aspects. All functions support customization. The different parts in the images above are the same currency and time period, achieving different effects through setting modifications. If you prefer comprehensive features, you can enable more functions; if you prefer a simple style, you can disable unnecessary indicators. The functionality is very powerful and easy to use; you will understand after trying it a few times. Below is a simple example image.
Parameter Settings
Regarding settings, to accommodate friends who may not understand much, in this version, I have added detailed explanations next to each parameter and option, making it easier for users to understand their actual functions. The parameter design is completely open-ended, allowing full customization in the settings. Of course, this is mainly for experienced professional traders to better fit their own trading styles. However, if you are not very familiar with it or are a novice, I suggest directly using my default values. I have optimized them through practical testing, making them applicable in most situations, essentially a universal choice. Below is a screenshot of part of the parameter customization options.

Alert System
Finally, the model is also equipped with a very comprehensive alert system. The new version has added some options; these alerts can be configured for any currency and any time period, and you can modify alert conditions, customize alert content, and more details. Currently, there are quite a few supported options, and I won't list them all here; you can see them directly in the images, which are clearly labeled. Once the alert conditions you set are met, real-time message notifications will be sent directly, supporting app and email notifications, effectively giving you a fully automated AI assistant to monitor the market continuously, which is very convenient and quite good.

More Alert Configurations
There is also the potential for more alert signals. Considering that some friends may not have membership privileges on the platform, the number of configurable alerts is therefore limited. I specifically established a group to use my own membership rights to help everyone, directly connecting to the platform's Webhook signals, providing more possibilities for free users through robots. All signals and alerts are real-time forwarded with no delays, very convenient.


Summary
To be honest, there are very few people willing to completely disclose their entire trading system in public. Most KOLs lack the capability; their calls are all based on feelings, relying solely on words, and often fail to provide reasons or logic for their trades. This is truly undesirable. As someone who has been through this, my advice is that everyone should establish their own trading system and strictly implement it over the long term. I hope my model helps those in need.
Overall, this indicator model can be considered an 'all-rounder,' with exceptionally powerful functions analyzing from multiple angles, from basic trend judgments to support/resistance level scouting, buying and selling entry signals, price and indicator divergences, along with multi-indicator auxiliary analysis and long-term screening of various currencies. It basically covers every important aspect of trading and is definitely one of the advanced models you can encounter. Its versatility allows for use in both contract and spot trading (I personally recommend spot trading), and it can be applied for ultra-short, short, mid, or long-term trading (I personally recommend mid to long-term). Its level is absolutely higher than most of the so-called 'perpetual profit teachers' in the community. Whether you are a trading novice or an experienced trader, even a KOL or trader, this model can provide great assistance and enhance your trading level.
The software used for the model is TradingView, accessible on both mobile and computer, and is free and convenient.
Of course, the model is just a tool; the most important thing is still your own judgment ability. It only provides a semi-automated trading method. If you are staring at an empty market chart feeling lost, or even gambling in the investment market, its help is undoubtedly immense. Your trading thought process and precision in understanding the market will significantly improve. You will only know the specific effects by trying it yourself!
Supports unconditional free trial!
Finally, if anyone has suggestions for optimization, feel free to share and discuss in the comments. Let's work together to improve and wish everyone abundant wealth this year!