Coin Name: #rsr
Position: LONG
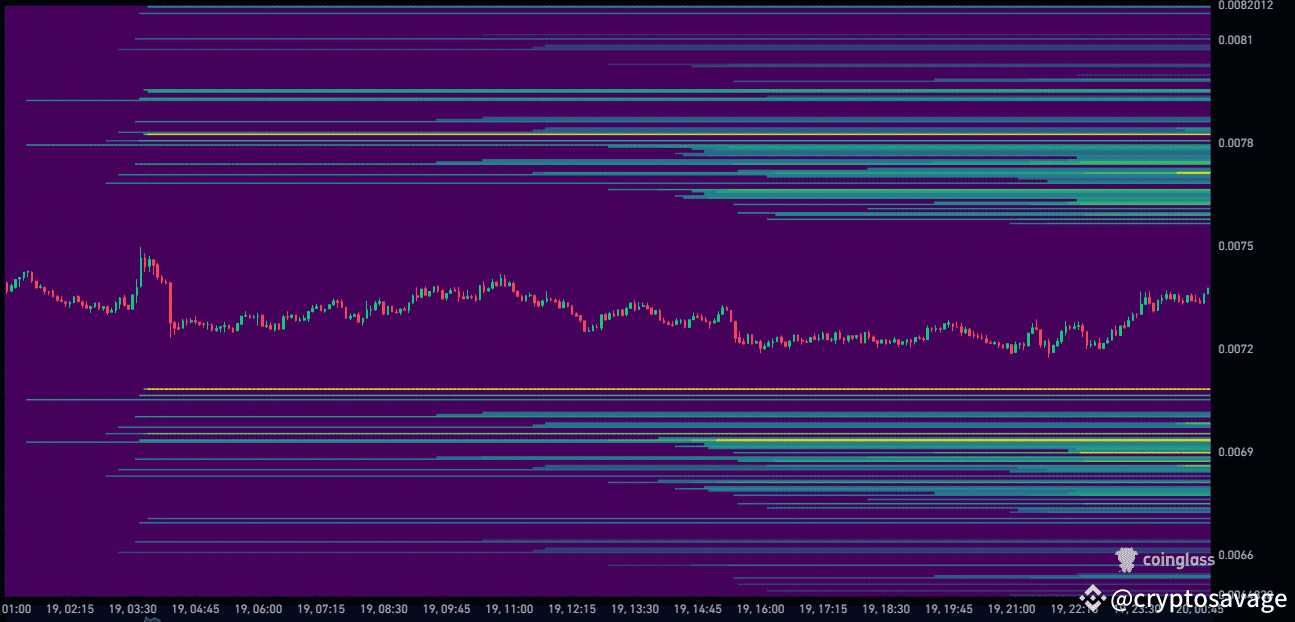
This chart displays a bullish flag pattern for RSR on the 30-minute timeframe. A bull flag is a continuation pattern that forms after a strong upward move, followed by a consolidation phase within parallel downward-sloping trendlines. The current price action shows the price nearing a breakout above the upper trendline, suggesting a potential continuation of the previous bullish trend. The projected move targets the 0.007690 level, with a stop-loss set below recent support at 0.007172.

There’s a significant concentration of liquidation levels above the current price, indicating a liquidity pool that could attract upward price movement. Given this setup, it’s likely that RSR will push higher to tap into that liquidity, which aligns with my bullish outlook on the asset.
Entry Price: 0.007346
Targets:
1st TP 0.007450
2nd TP 0.007550
3rd TP 0.007680
Leverage: 5X
This is my personal prediction, but as we all know, the crypto market is highly volatile. If you're considering this trade, be sure to conduct your own thorough research before making any decisions.
$RSR
For more insights and future signals, check out my Bio and tune into my Binance live stream for real-time analysis and updates!