Hello everyone, I am Panda Brother. $SOL Increased a little, don't get excited.
Let's start with the result: bearish. This is just a distribution, and I will explain in detail in the next two pictures.
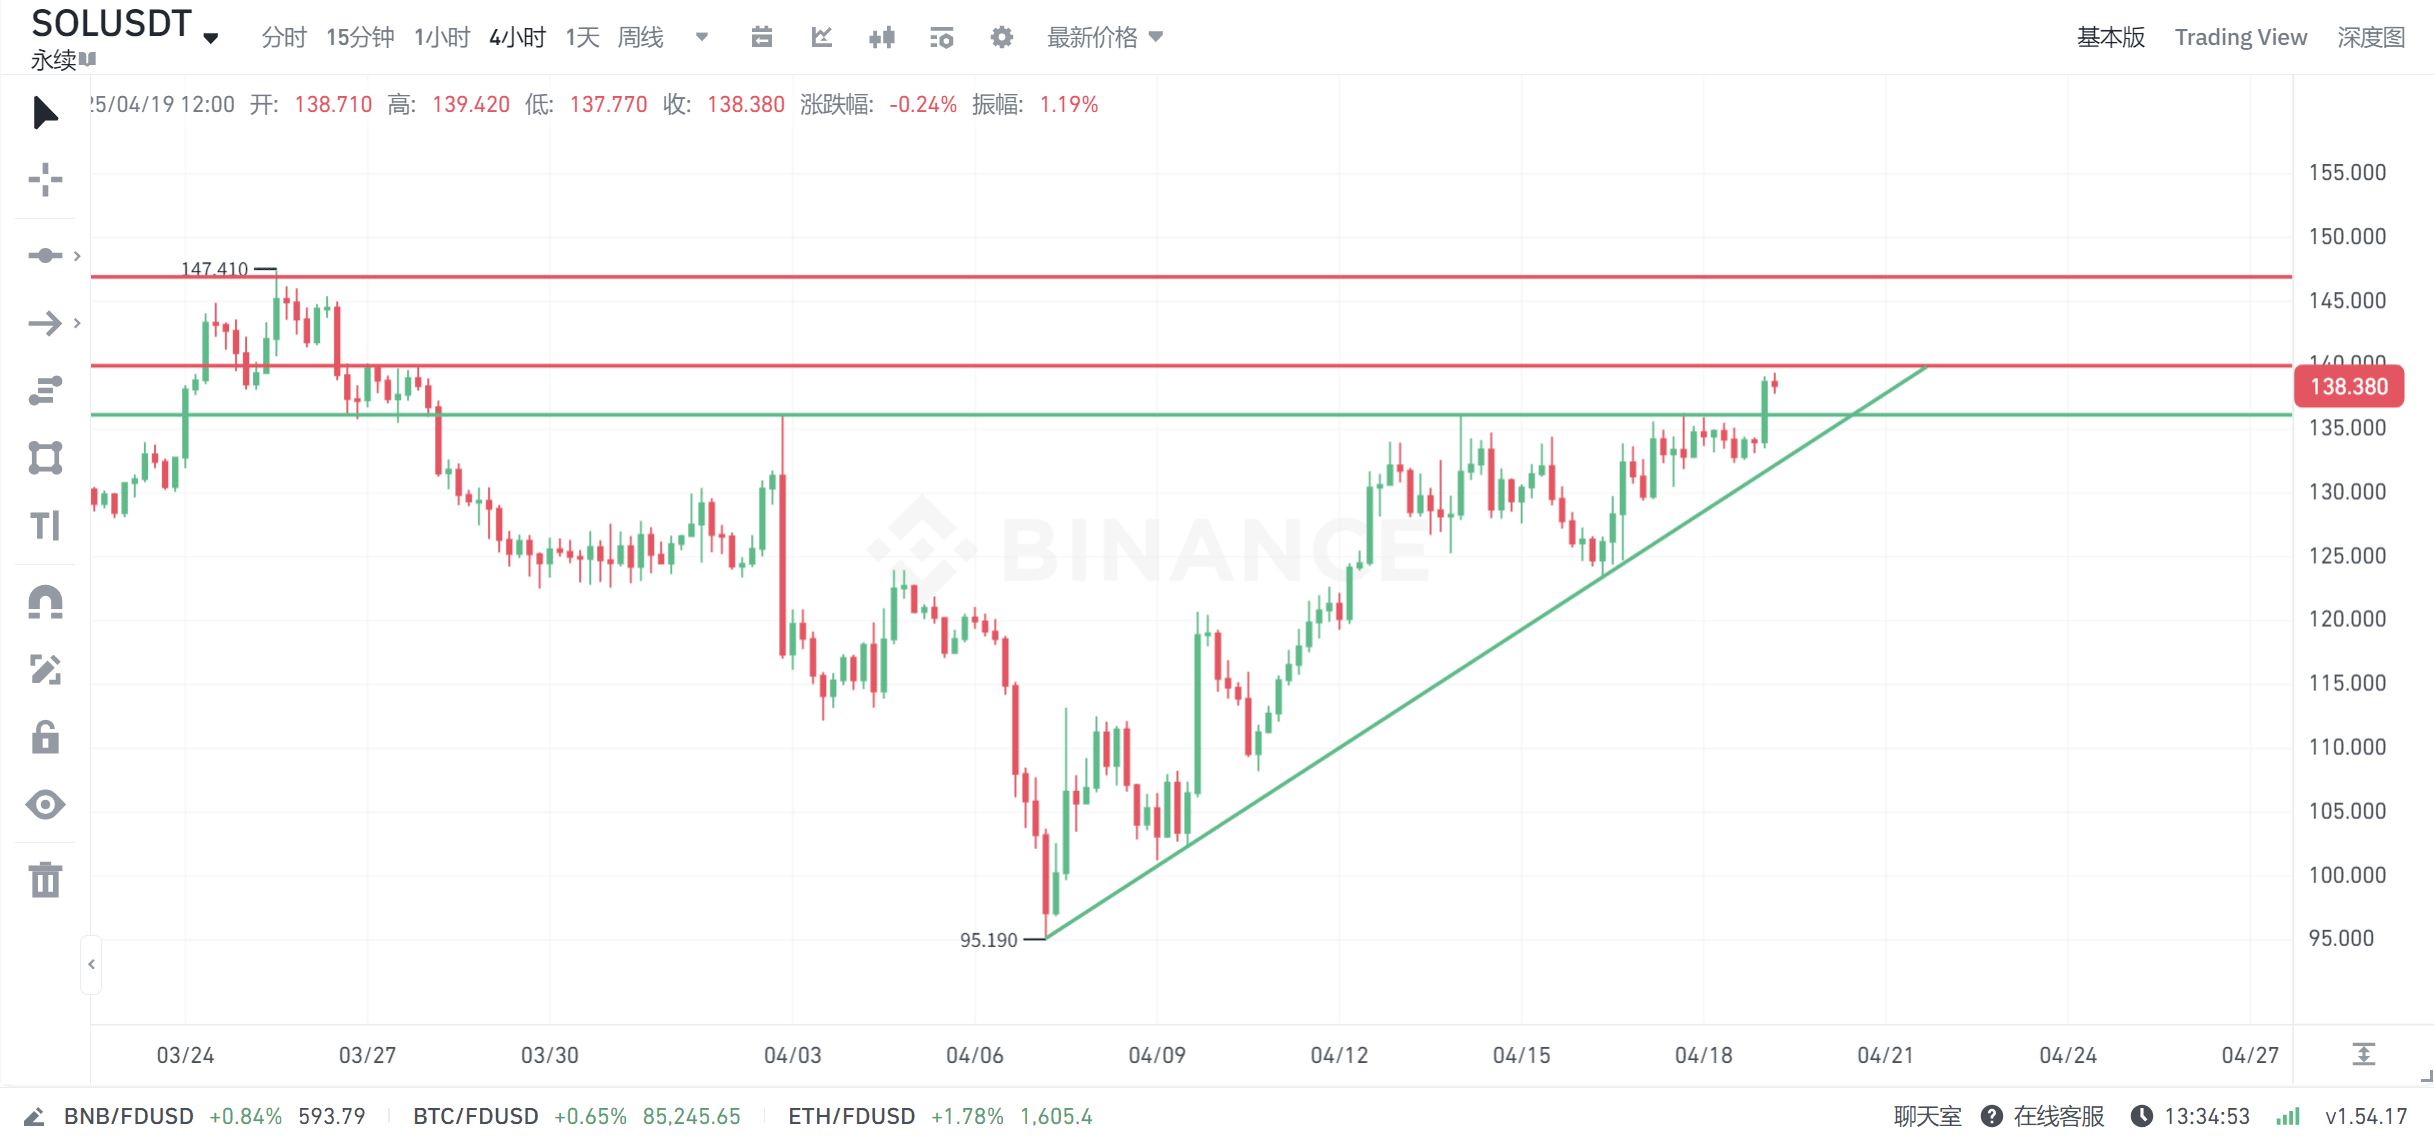 This is the 4-hour chart of SOL. Currently, there are three or four resistance levels above, and the big coin’s daily chart has been consistently testing its top and bottom. Can you say that if the big coin drops, SOL will rise by itself? Definitely not, unless there’s a major event on-chain, but what is the probability of that? Looking at this chart, what do you notice? The green triangular area has already broken through and is being held down by the upper resistance level. It is currently within the triangle formed by the red and green lines. Before reaching the end of this triangle, there will be a direction decided at the latest end of this triangle. Considering the big coin’s daily top and bottom, this may be the high point for SOL in the coming days. Opening a short position should be fine; I’ve already opened a short as a precaution, and I plan to exit around 136.123. I don’t want to be greedy—don’t treat money lightly. Selling high and buying low isn’t just a saying.
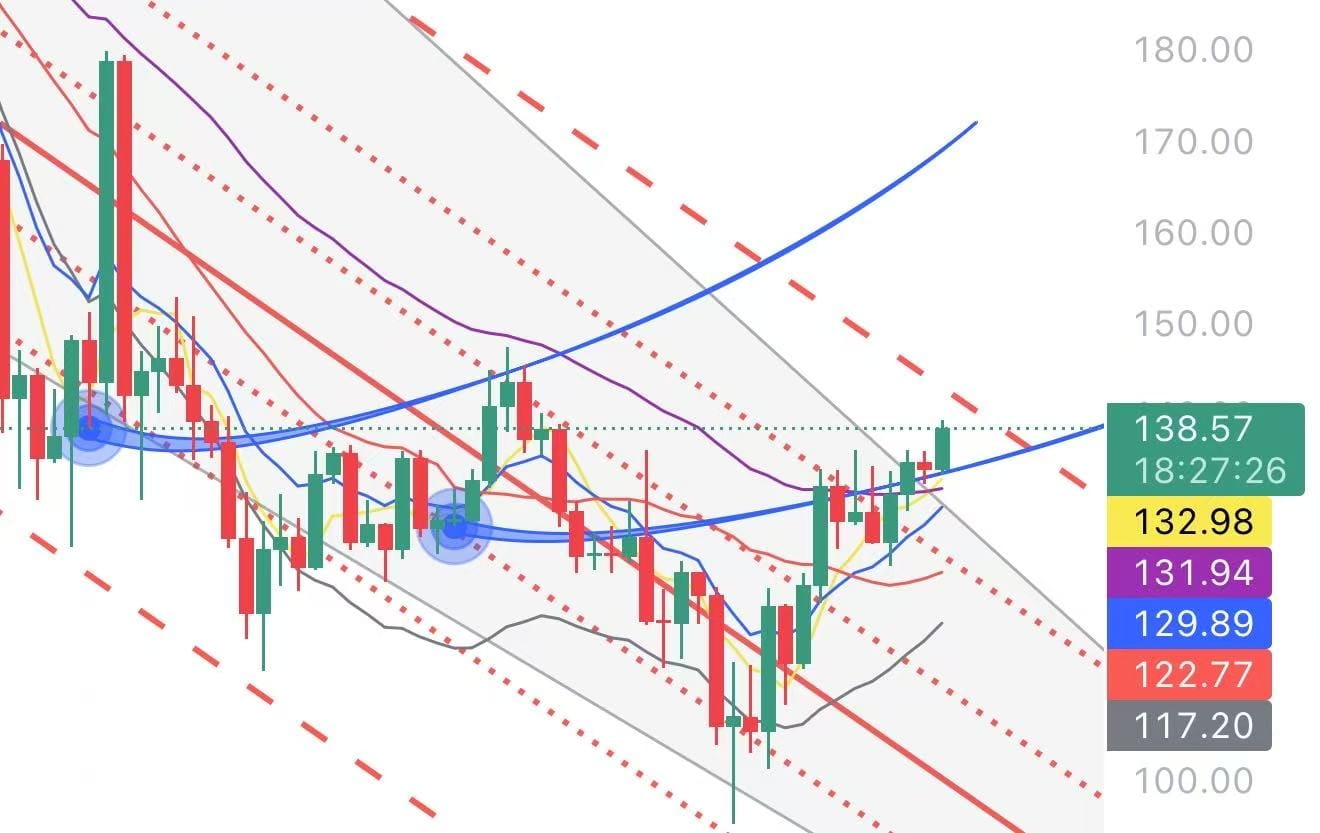 Let's look at this daily chart of SOL. Although it broke through and tested the spike once without breaking it, the overall daily channel hasn’t been established yet. It was pushed down by the first resistance level on the daily chart right after it went up. Still considering the top and bottom of the big coin’s daily chart, if the big coin goes down, SOL will also go down. As long as you can hold on, it hasn’t exited the downward channel at the daily level. This position is considered a relative high point for the next few days. Everyone has different knowledge and insights. If you’ve seen these two charts, what are your thoughts? Feel free to discuss in the comments.
