It's a tool that, once understood, allows you to predict when the market will rise or collapse; Fibonacci is not just lines... it's the most powerful tool in the hands of the smart trader
A thread that explains everything simply:
(1/13) 🧵

Fibonacci Correction (Fibonacci Retracement)
Used to identify important price levels
These are the areas where the price may stop, reverse its direction, or continue in the same trend
These levels depend on the Fibonacci sequence
The main ratios are: 23.6%, 38.2%, 50%, 61.8%, and 78.6%

1.1 Fibonacci Correction in the upward direction (Bullish Fibonacci Retracement)
The price is in an uptrend, then goes through a period of calm or correction, forming a higher low
This is considered an opportunity to enter buy positions at lower prices, in preparation for a new upward impulse

1.2 Fibonacci Correction in the downward direction (Bearish Fibonacci Retracement)
The price is in a downtrend, then goes through a period of calm or correction, forming a lower high
This is considered an opportunity to enter sell positions at higher prices, in preparation for a new downward impulse

1.3 Fibonacci Correction
This chart shows Fibonacci correction from bottom to top (Swing Low to Swing High)
The price respected the key levels:
It bounced twice at the 0.618 level (the golden ratio) and has been rejected several times at the 0.382 level
These areas are often strong support and resistance areas

1.4 Fibonacci Correction
This chart shows a downtrend followed by a correction
The price faces resistance at levels 0.618 and 0.65, confirming they are important areas
Level 0.382 acted as strong support initially before being broken
The price always bounces or corrects at certain levels

2. Fibonacci Expansion
Fibonacci expansion tool is used to predict future price levels
It shows you where the price could reach if it continues in the same trend direction
In other words, it predicts the new high for the price before it actually reaches it

2.1 Fibonacci Expansion
Fibonacci expansion defines potential future price targets that exceed the original swing
Measures from the bottom to the top as a baseline
Then it applies extension levels like 100% and 161.8% to identify potential resistance or support areas

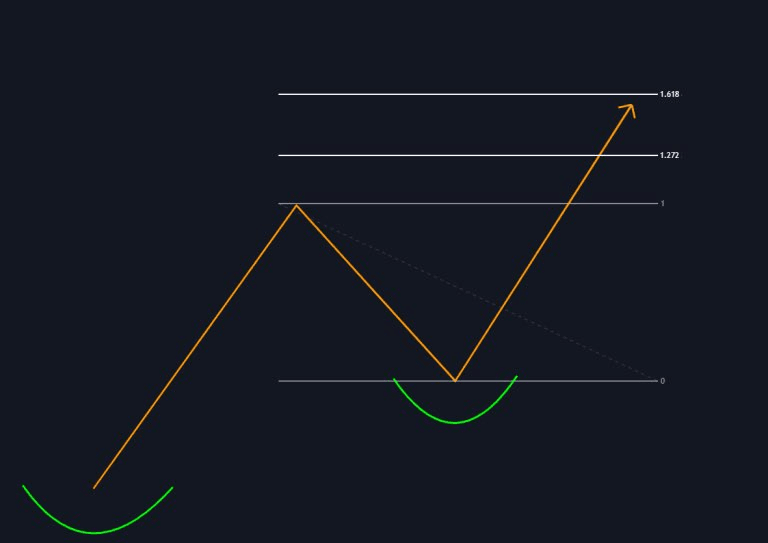
2.2 Fibonacci Extension - in the upward direction
In the case of an uptrend (higher lows and higher highs), the price goes through a correction period, forming a higher low
After confirming this low, the price rises above the previous high, continuing in the upward direction
2.3 Fibonacci Extension - in the downward direction
In the case of a downtrend (lower lows and lower highs), the price goes through a correction period, forming a lower high
After confirming this high, the price falls below the previous lows and continues to drop

3. How to draw Fibonacci levels
This is a picture of my Fibonacci correction tool settings list
You can add or change values and colors at your convenience
I advise you to use colors you like to make the final chart look unique and comfortable for you

3.1 How to draw Fibonacci levels
These are Fibonacci correction levels highlighting a balance point (CE)
They are often close to level 0.50, considered a middle area where the price may stop or reverse
The candlestick drawing shows how a balance is achieved between sellers and buyers around this area

3.2 How to draw Fibonacci levels
What is shown here are the standard deviation levels in Fibonacci, clearly marked from 0 to -4
Each level defines an important support or resistance area
The price may bounce from it or continue the trend in its direction


