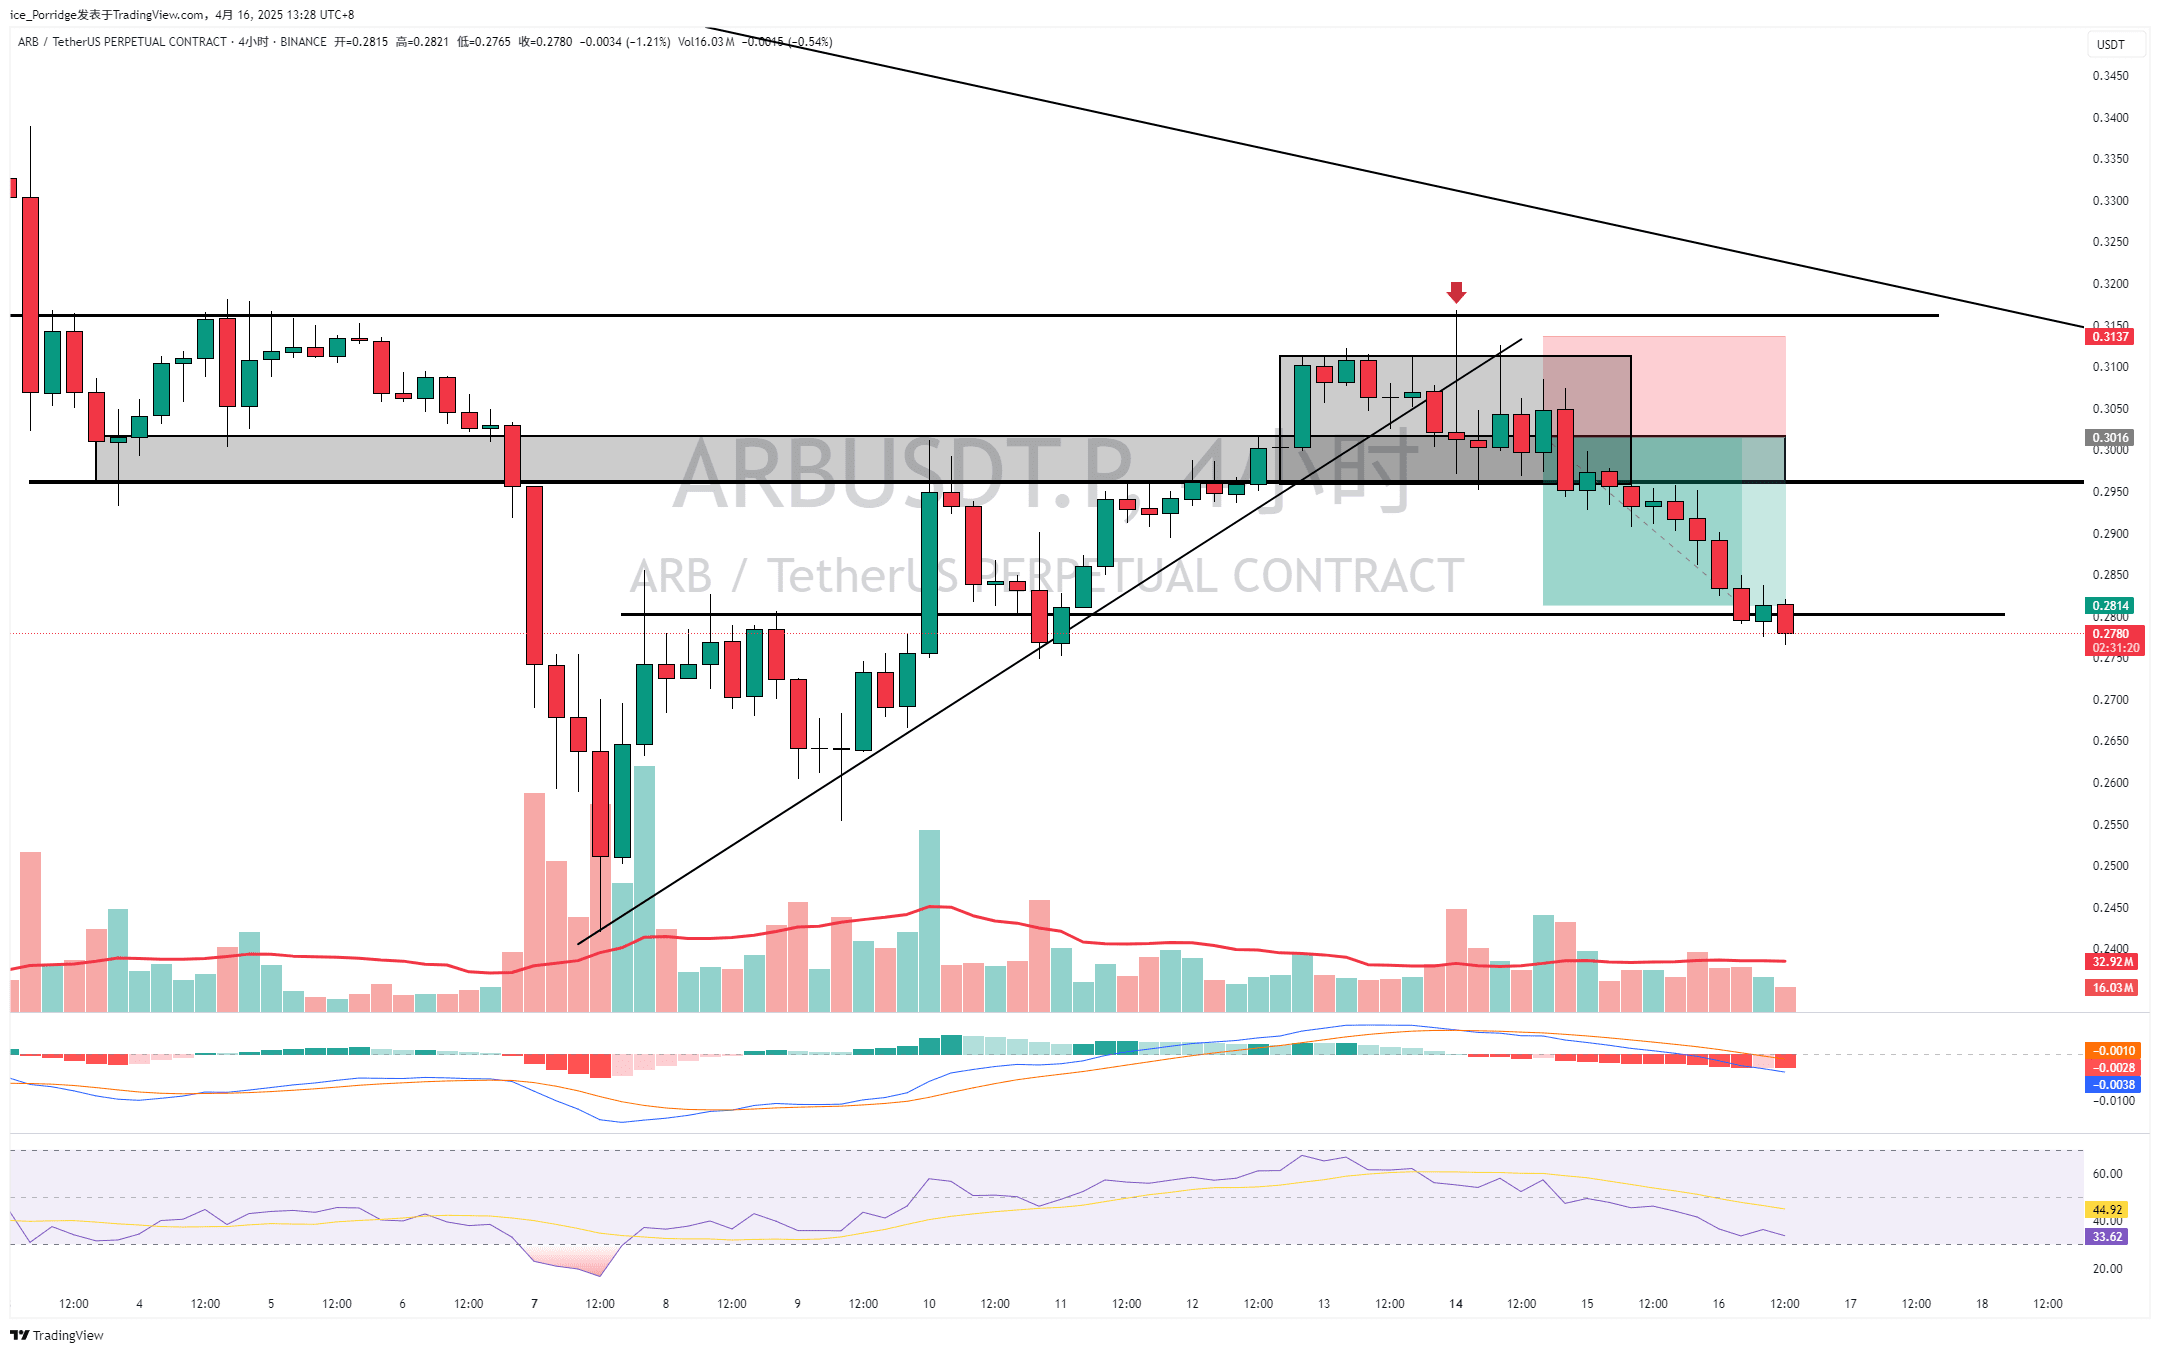
$ARB April 14 short position logic, first look at the chart:
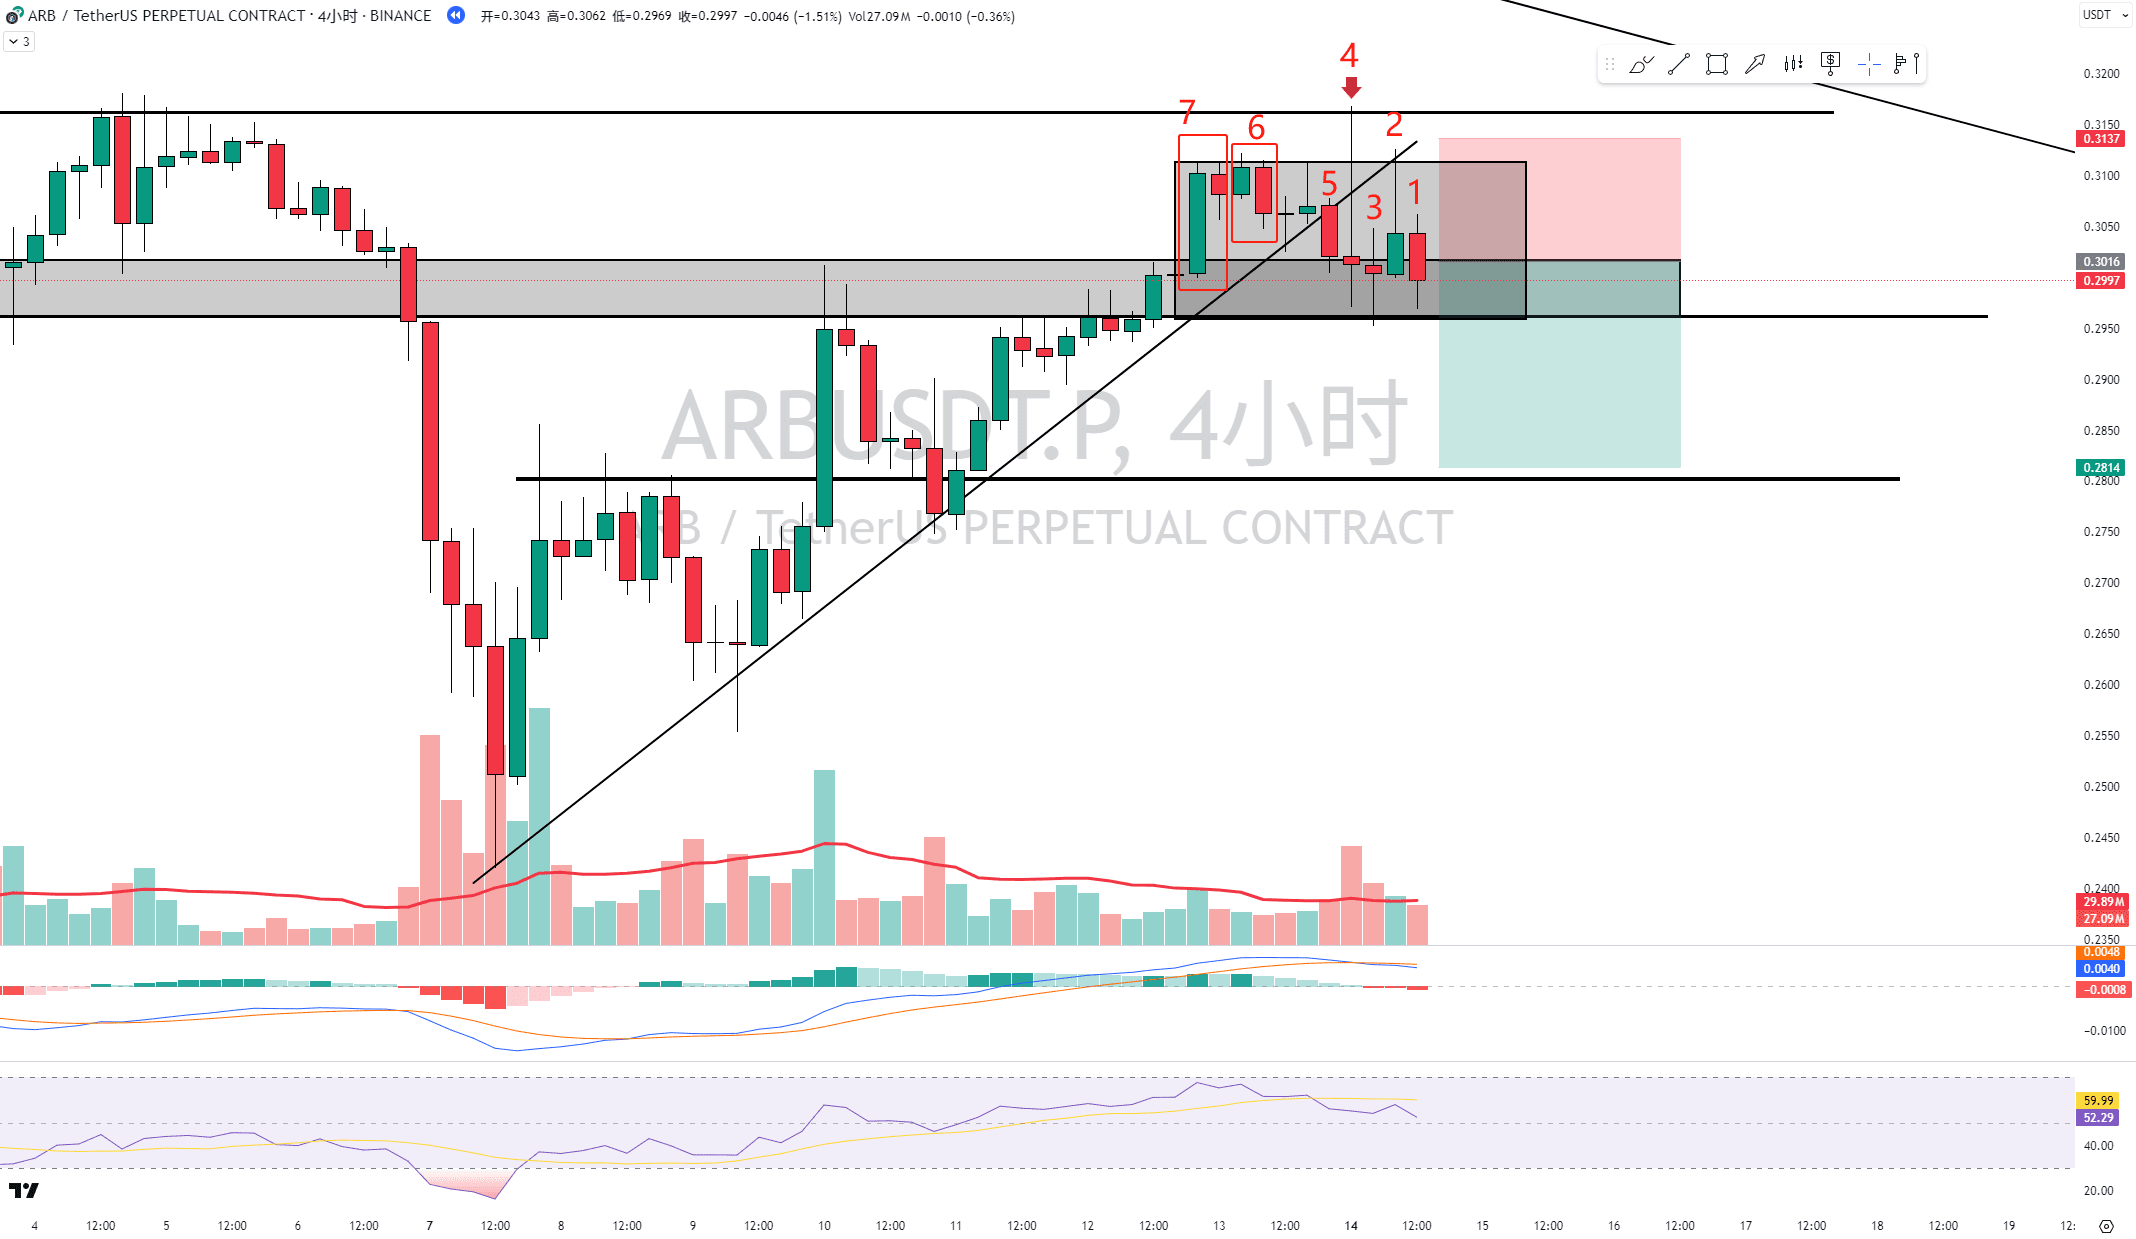
K1: Small bearish candlestick accompanied by reduced volume, closing below K2's closing price and within a key area. If read in conjunction with (Japanese candlestick techniques) and K2, this is a bearish signal.
K2: Shooting star candlestick accompanied by decreasing volume. The price attempted to break upward, but the bears did not exert much force and pushed the price down. The body is a small bullish candlestick (closing below 50% of the candlestick), indicating that selling pressure is greater than buying pressure, which K1 verified.
K3: Doji candlestick accompanied by above-average trading volume, indicating fierce competition between bulls and bears, and neither side can prevail. We need to observe subsequent market candlestick reactions or smaller timeframe candlestick charts for interpretation. Therefore, K2 somewhat implies luring the enemy deeper.
K4: Bearish Pinbar accompanied by high volume. This candlestick and volume are quite prominent on the chart, appearing at a high point of a rebound and in a key area, which requires special attention. It also shows a false breakout, breaking above the previous high but closing below the opening price, so the resistance target should move downward. Coupled with the trend analysis, if the overall trend is downward, does this candlestick indicate the end of the current rebound and that the market will continue to decline? Actually, at this point, this logic is enough for you to open a short position. But it is not over yet.
K5: Compared to earlier candlesticks, small bearish candlestick accompanied by increased volume indicates that the floating supply in the market is expanding, and it has broken the trend line. Personally, I felt that the volume was insufficient for this breakdown, so I did not short at that time.
K6: Rebound high point, forming a bearish engulfing pattern, a strong bearish signal, and also a trading signal on a naked candlestick chart.
K7: Bearish pregnant candlestick, which is a bearish signal but not a trading signal. It indicates that the market may soon reach its peak, reflecting market weakness. At this point, it's important to frequently observe the chart to capture right-side signals for shorting and initiate trades. If the volume of the second candlestick that forms the pregnant candlestick is larger, its warning effect is stronger, and the probability of reversal is greater.
Macroeconomic: The Pinbar is clearly at a high point of a rebound, but structurally it has not made a new high, so it still maintains a bearish attitude. This includes the one-hour timeframe, which indeed has broken below the one-hour trend line and created a lower low. The 8-hour chart is also closing bearish. Generally, a normal correction consists of 1-2 candlesticks; 3 candlesticks would indicate a more complex correction. Moreover, on the one-hour chart, it can be seen that it is in a consolidation range. Here’s a key point: why does a consolidation range indicate a direction regardless of whether it breaks or falls? Because the consolidation range is nurturing a trend, gathering strength for what comes next. Therefore, capturing this bearish consolidation range is crucial, and holding positions before breaking the consolidation range is very uncomfortable.