In this class, we will discuss the core concept of trends in trading.
🧐 Think about what a trend is?
In trading, a trend refers to the main direction in which the price moves over a period of time. You can think of a trend as the direction of the water flow in a river—where the water flows, the price goes.
🎈 Why is the trend important?
Following the trend is the core principle of trading
As the saying goes,"The trend is your friend"If the market is rising, going long (buying) is more likely to be profitable; if the market is falling, going short (selling) may be more profitable. Trading against the trend is not only tiring but also risky.Help you determine buy and sell points
In an upward trend, buying during a pullback is a wiser choice; whereas in a downward trend, selling during a rebound is a better strategy.Avoid ineffective operations
During a sideways trend, the market fluctuates minimally, and many beginners frequently enter and exit, resulting in merely paying "transaction fees." Recognizing the trend can help you avoid such ineffective actions.
📖 How to determine the direction of a trend
Determining a trend requires combining price movements with technical tools. Here are a few common methods:
Observe high and low points
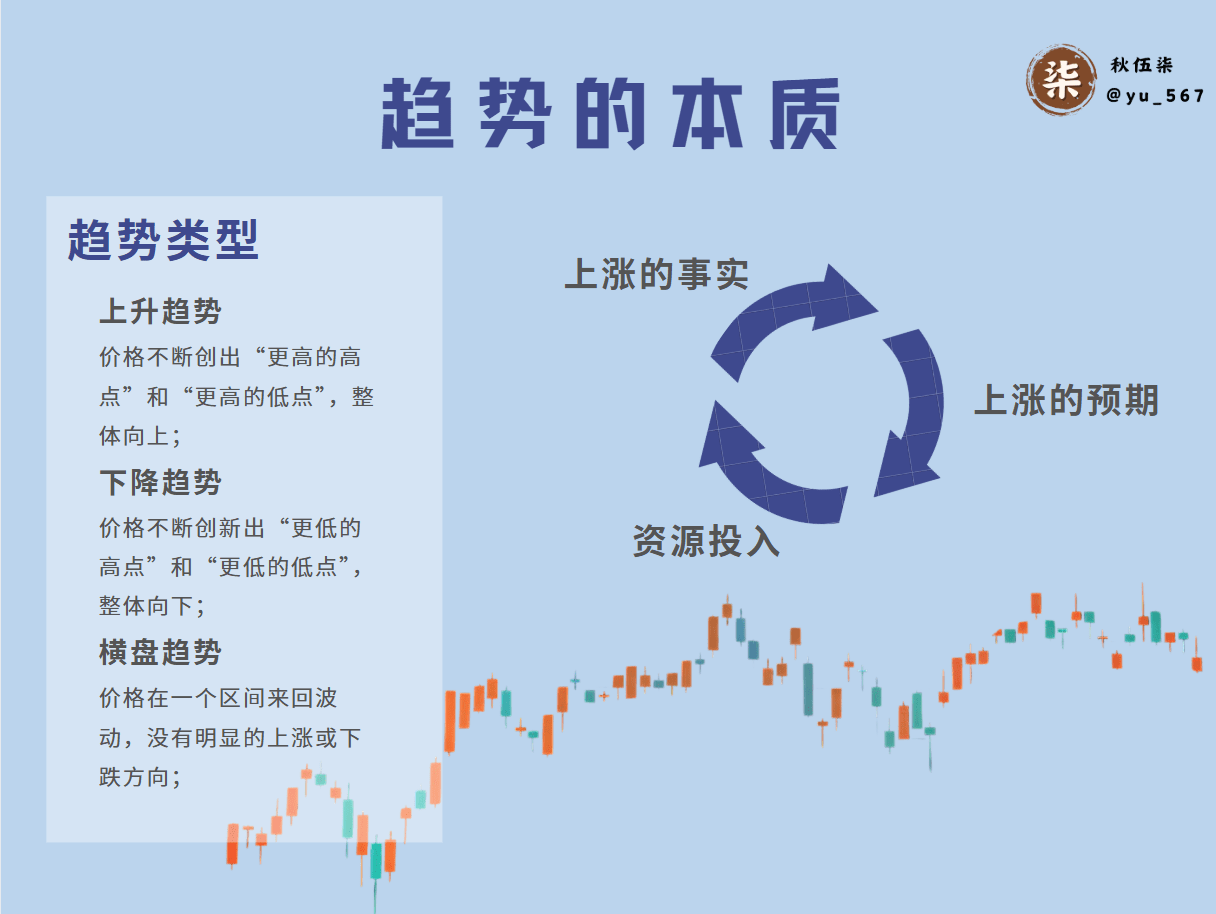
Upward trend: High and low points continually rise
Downward trend: High and low points continually fall
Sideways trend: High and low points fluctuate within the same range
Use technical indicators
Use moving averages (MA) to determine
Trend lines
Draw a straight line connecting the price lows or highs on the candlestick chart, and observe whether the price moves along this line.
🏷️ How to identify a trend reversal
A trend reversal refers to a change in the direction of the market price movement. Here are some common judgment methods:
1. Candlestick pattern reversal signals:
Head and shoulders top/head and shoulders bottom
Double top/double bottom (M shape/W shape)
Single reversal candlestick
2. Technical indicator reversal signals
RSI divergence
MACD death cross/golden cross
Bollinger Bands breakout
3. Breakthrough of key support/resistance levels
When the support level breaks during a pullback, the upward trend turns into a downward trend.
When the resistance level breaks during a pullback, the downward trend turns into an upward trend.
