In this session, we will discuss a very core concept in trading: the relationship between volume and price.
🔑 A vivid explanation of the relationship between volume and price: The war between bulls and bears
In financial markets, the relationship between price and trading volume is like a smoke-free 'war', with participants divided into bulls (longs) and bears (shorts). The bulls want to 'capture cities and lands' to push prices up; while the bears try to 'defend the city and counterattack' to lower prices. Trading volume is like the 'military supplies' of this war, determining the scale of the conflict and the key to victory or defeat.
📊 What is 'volume'? (Trading volume)
Trading volume refers to the intensity of the 'battle' between bulls and bears in the market. Just like the number of soldiers involved in a fight, the larger the trading volume, the more participants there are on the battlefield, reflecting a larger scale of war.
- Volume increase: The battlefield has 'ample troops', both bulls and bears are fully engaged, and market sentiment is very intense.
- Volume decrease: The battlefield has 'insufficient troops', both sides are observing, and market trading is light.
Trading volume not only indicates the scale of the battle but also hints at the morale of the bulls or bears. If trading volume increases when the price rises, it indicates the bulls are launching a strong offensive; if trading volume increases when the price drops, it indicates the bears are launching a fierce counterattack.
---
📈 What is 'price'? (Price)
Price is the 'fruit of war'. It represents the outcome of the battle between bulls and bears over a certain period:
- Price rise: Bulls have the upper hand, successfully capturing cities and lands.
- Price drop: Bears successfully counterattack and hold their ground.
- Price flat: Both sides are relatively balanced in strength, and the battlefield temporarily enters a stalemate.
Price fluctuations are a direct reflection of the strength comparison between bulls and bears, while trading volume is the energy source behind this confrontation.

📋 How to interpret the relationship between volume and price?
1. Volume increase and price rise: The bulls and bears engage in a fierce battle, ultimately the bulls annihilate the bear forces.
2. Volume increase and price drop: The bulls and bears engage in a fierce battle, the bears successfully counterattack and annihilate the bulls.
3. Volume decrease and price rise: The bulls capture small strongholds of the bears, but there are still bear forces resting in the back.
4. Volume decrease and price drop: The bear forces capture small strongholds of the bulls, while the bull forces wait in the back for a chance to strike.
5. No volume flat: Both sides are recruiting soldiers, waiting for the right moment to strike.
Summary: Only victories achieved after annihilating the opposing main force (volume battlefield) are valuable; battles with low casualties do not reveal how much strength of the enemy has not yet been committed to battle.
---
📌 Summary: The relationship and significance between volume and price
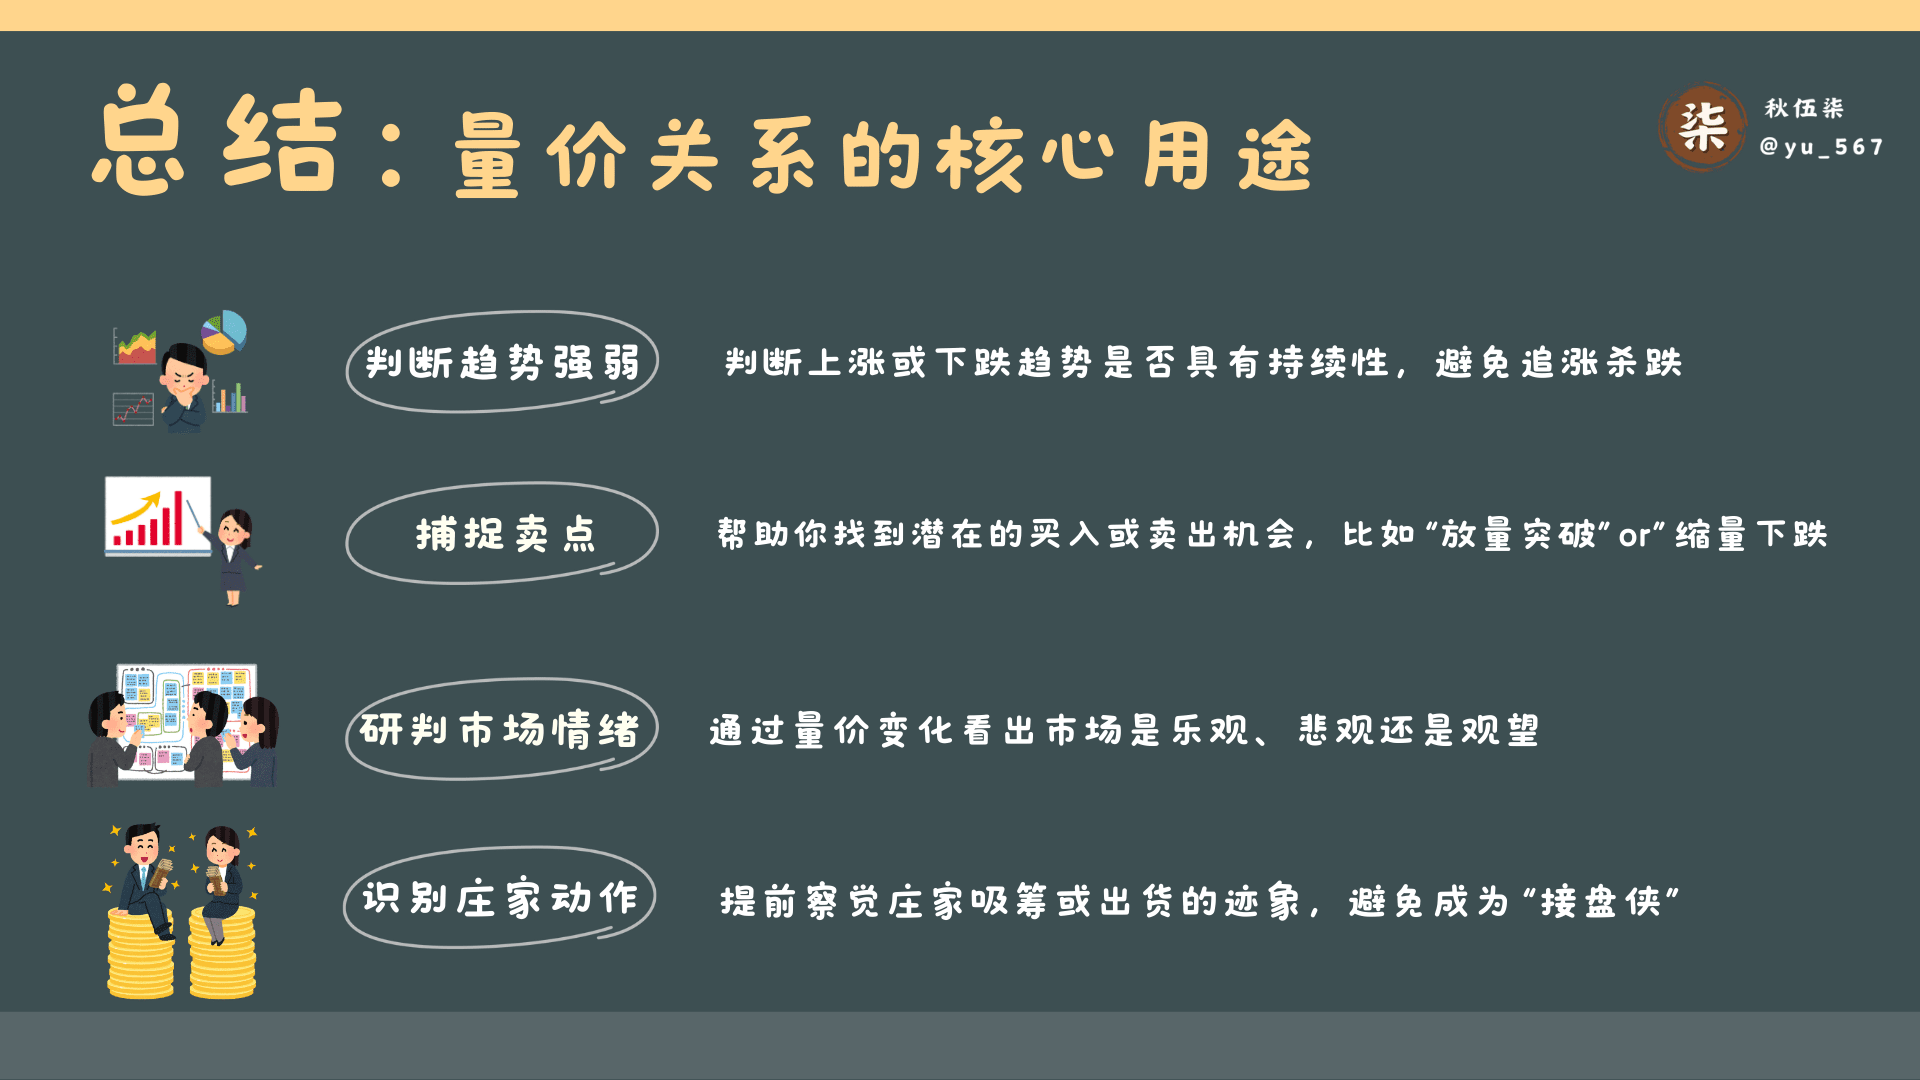
📌 How to utilize the relationship between volume and price?
- Support and resistance: In upward or downward trends, an increase in trading volume is usually a confirmation signal for the continuation of the trend.
- Pay attention to volume expansion points: When breaking through key support or resistance levels, if accompanied by increased trading volume, it is usually an effective breakthrough.
- Beware of volume decline during rebounds: If the price rises but trading volume significantly shrinks, it should be treated with caution as it may be a false rise.
Analysis combined with candlestick charts is more effective: Simply looking at the volume-price relationship may not be precise enough; combining it with candlestick patterns (such as breakout patterns, doji, etc.) can improve the accuracy of judgments.
Avoid relying solely on trading volume: Sometimes changes in trading volume may be temporary and should be analyzed in conjunction with the overall market environment and other indicators (like RSI, MACD).
