1. Chart Analysis (15-minute time frame)
Price and Trend
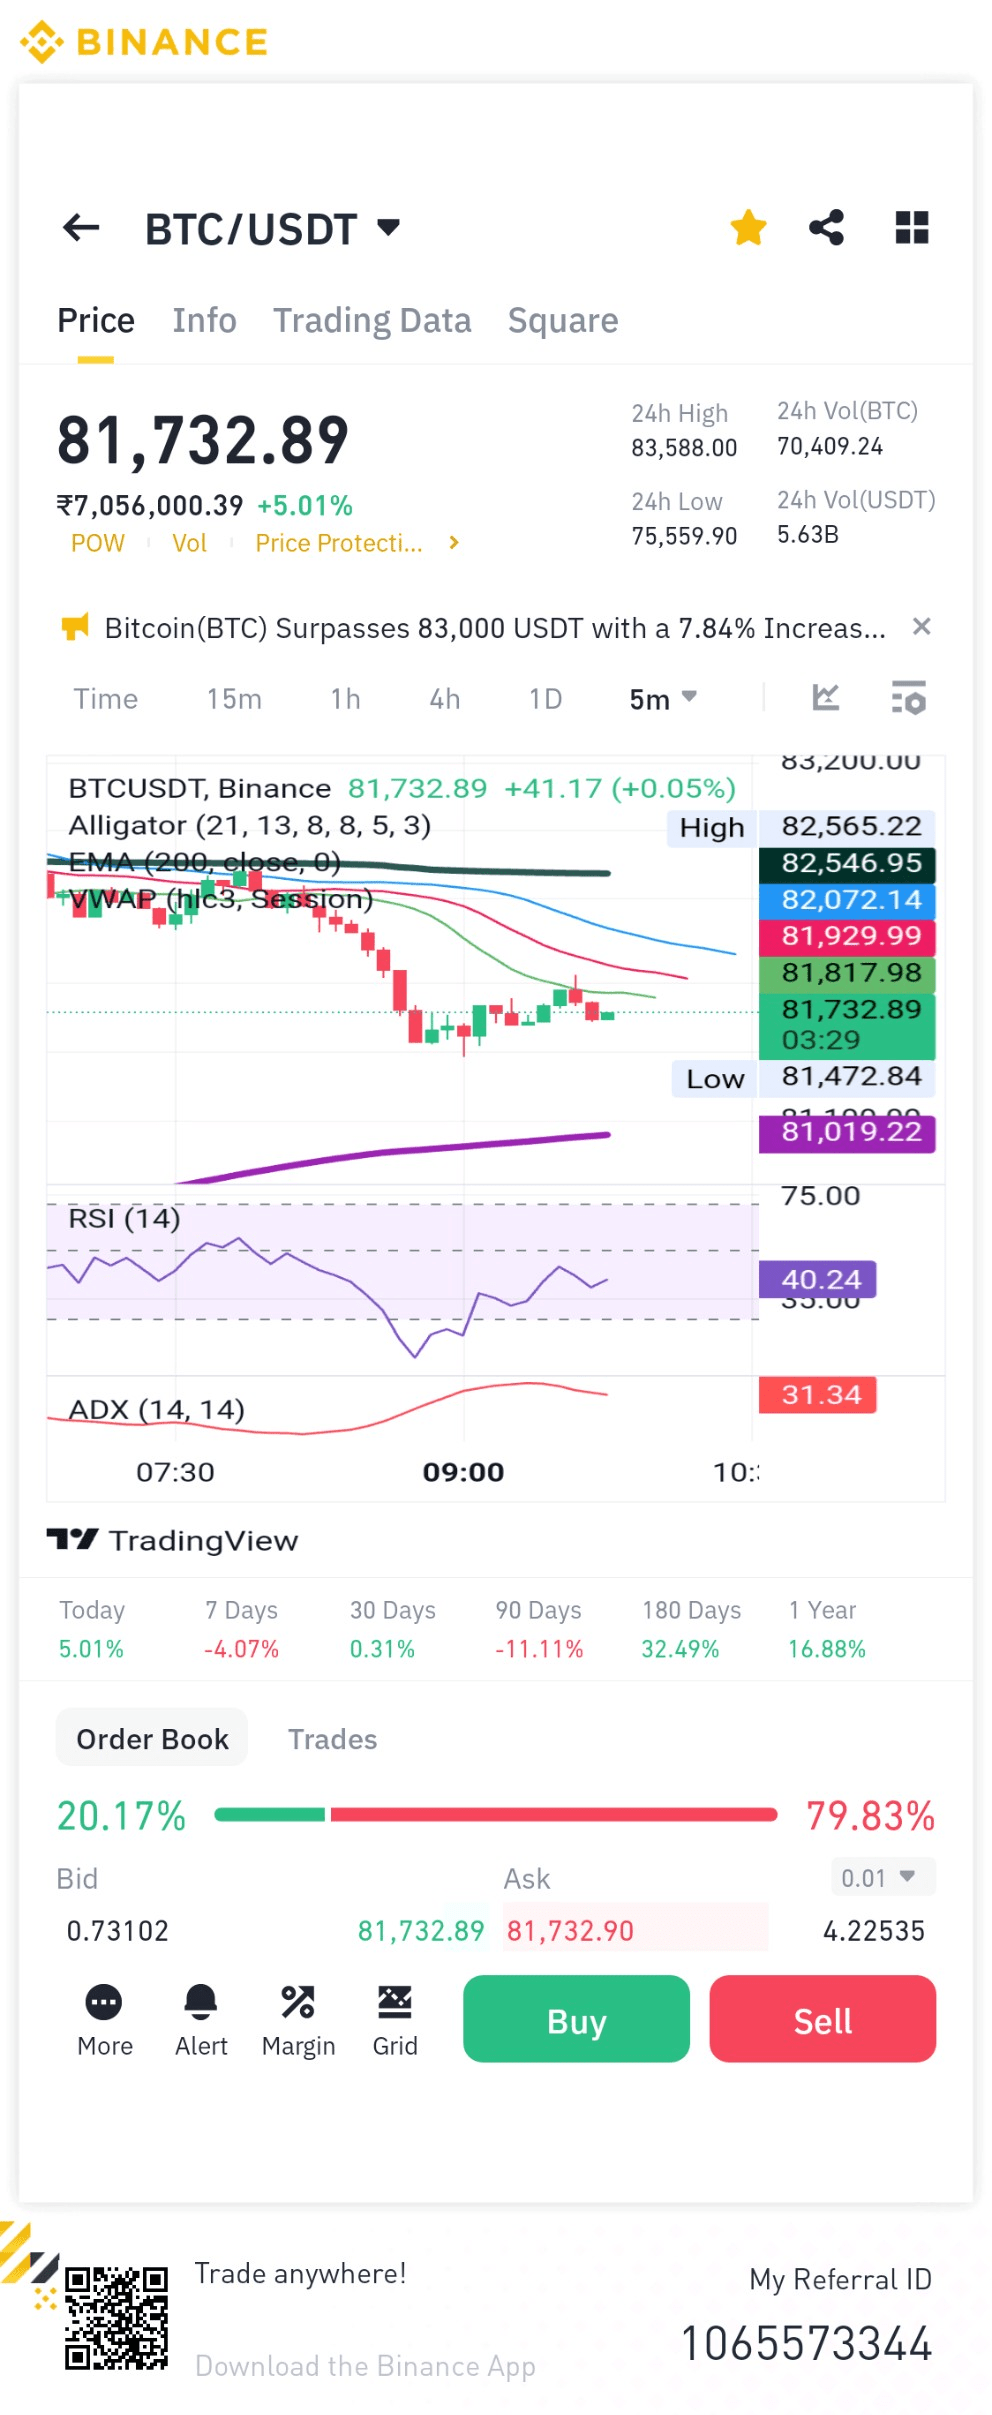
Current price: 81,732.89 USDT
24-hour increase: +7.84% (indicating a strong uptrend)
Recent highs and lows:
High: 82,565.22
Low: 81,019.22
The chart shows that the price has recently risen sharply and is in a strong uptrend between 81,000 and 82,000. However, it is slightly below its recent high (82,565), which could indicate a minor correction (pullback).
Technical Indicators
RSI (14): 50.24
RSI is around 50, which is in the neutral zone. It is neither overbought (above 70) nor oversold (below 30). This means there is currently no significant buying or selling pressure in the market. It is a balanced situation, but it is cooling down a bit after the uptrend.
ADX (14): 31.34
The ADX is at 31.34, indicating a medium trend strength. When ADX is above 25, the trend is considered strong, but being below 50 means the trend is not very strong right now. This suggests that there is an uptrend, but it could either gain more strength or pause.
Order Book
Bid: 20.17% (buying pressure)
Ask: 79.83% (selling pressure)
The order book shows high selling pressure, indicating that many traders are currently trying to book profits. This could push the price down.
2. Possibility of taking a long position
A long position means you expect the price to go up. Let's see if this is the right time or not:
Arguments in favor (for long position)
Strong uptrend: A 7.84% increase in the last 24 hours is a strong bullish signal. The price is also moving upward on the 15-minute chart.
RSI Neutral: RSI is at 50.24, indicating that there is currently no overbought condition. There may be potential for the price to move higher.
Recent support: 81,019.22 is a recent support level. If the price remains above it, it is a good sign for a long position.
Arguments against (for long position)
Selling pressure in the order book: There is a 79.83% ask (selling) pressure, indicating that traders are booking profits. This could lead to a price correction (pullback).
Recent high: The price has come down from a high of 82,565.22. This could be a resistance level, and if it fails to break it, the price may go down.
ADX medium: The ADX is at 31.34, indicating uncertainty about the strength of the trend. The trend could reverse or remain sideways.
My Suggestion
A long position may be risky right now as there is high selling pressure in the order book and the price is below recent highs. If you want to take a long position, wait for the price to stabilize above 81,019.22 (support) and then confirm breaking 82,565.22 (resistance).
Make sure to set a stop loss: If you take a long position, keep the stop loss below 81,000, so if the price goes down, losses are limited.
Wait for a pullback: If the price comes back around 81,200-81,300 and bounces from there, it could be a better entry point for a long position.
3. How will the market be today?
Short-term trend (15 minutes to 1 hour): The market might show a slight correction (pullback) now due to high selling pressure. However, if the price remains above 81,000, the uptrend may continue.
Daily trend: Following a 7.84% increase in the last 24 hours, there may be some profit booking in the market. However, the overall trend for Bitcoin is still bullish, especially if it breaks the resistance at 82,565. If that happens, it could go to 83,000 or higher. On the other hand, if it goes below 81,000, a correction to 80,000 is possible.
External factors: Macroeconomic factors (such as US interest rates, dollar index), institutional investment, and market sentiment have a significant impact on Bitcoin's price. Since my data is up to April 2025, I would suggest keeping an eye on today's news (such as Bitcoin ETF updates or regulatory news).
4. Final Advice
Long Position: Wait a little longer. Enter on a pullback around 81,200-81,300 if the price bounces from there. The long position will be stronger upon confirmation of breaking resistance (82,565).
Market Trend: There may be volatility in the market today, but the overall trend is bullish. Be cautious if it goes below 81,000, as that could be a bearish sign.
Risk Management: Always use stop loss and manage your risk. Rapid fluctuations are common in the crypto market.@Blockchain Titan
Disclaimer: Grok is not a financial adviser; please consult one. Don't share information that can identify you.
