According to the chart, the general trend for XRP/USDT during the last time period (15 minutes) shows:
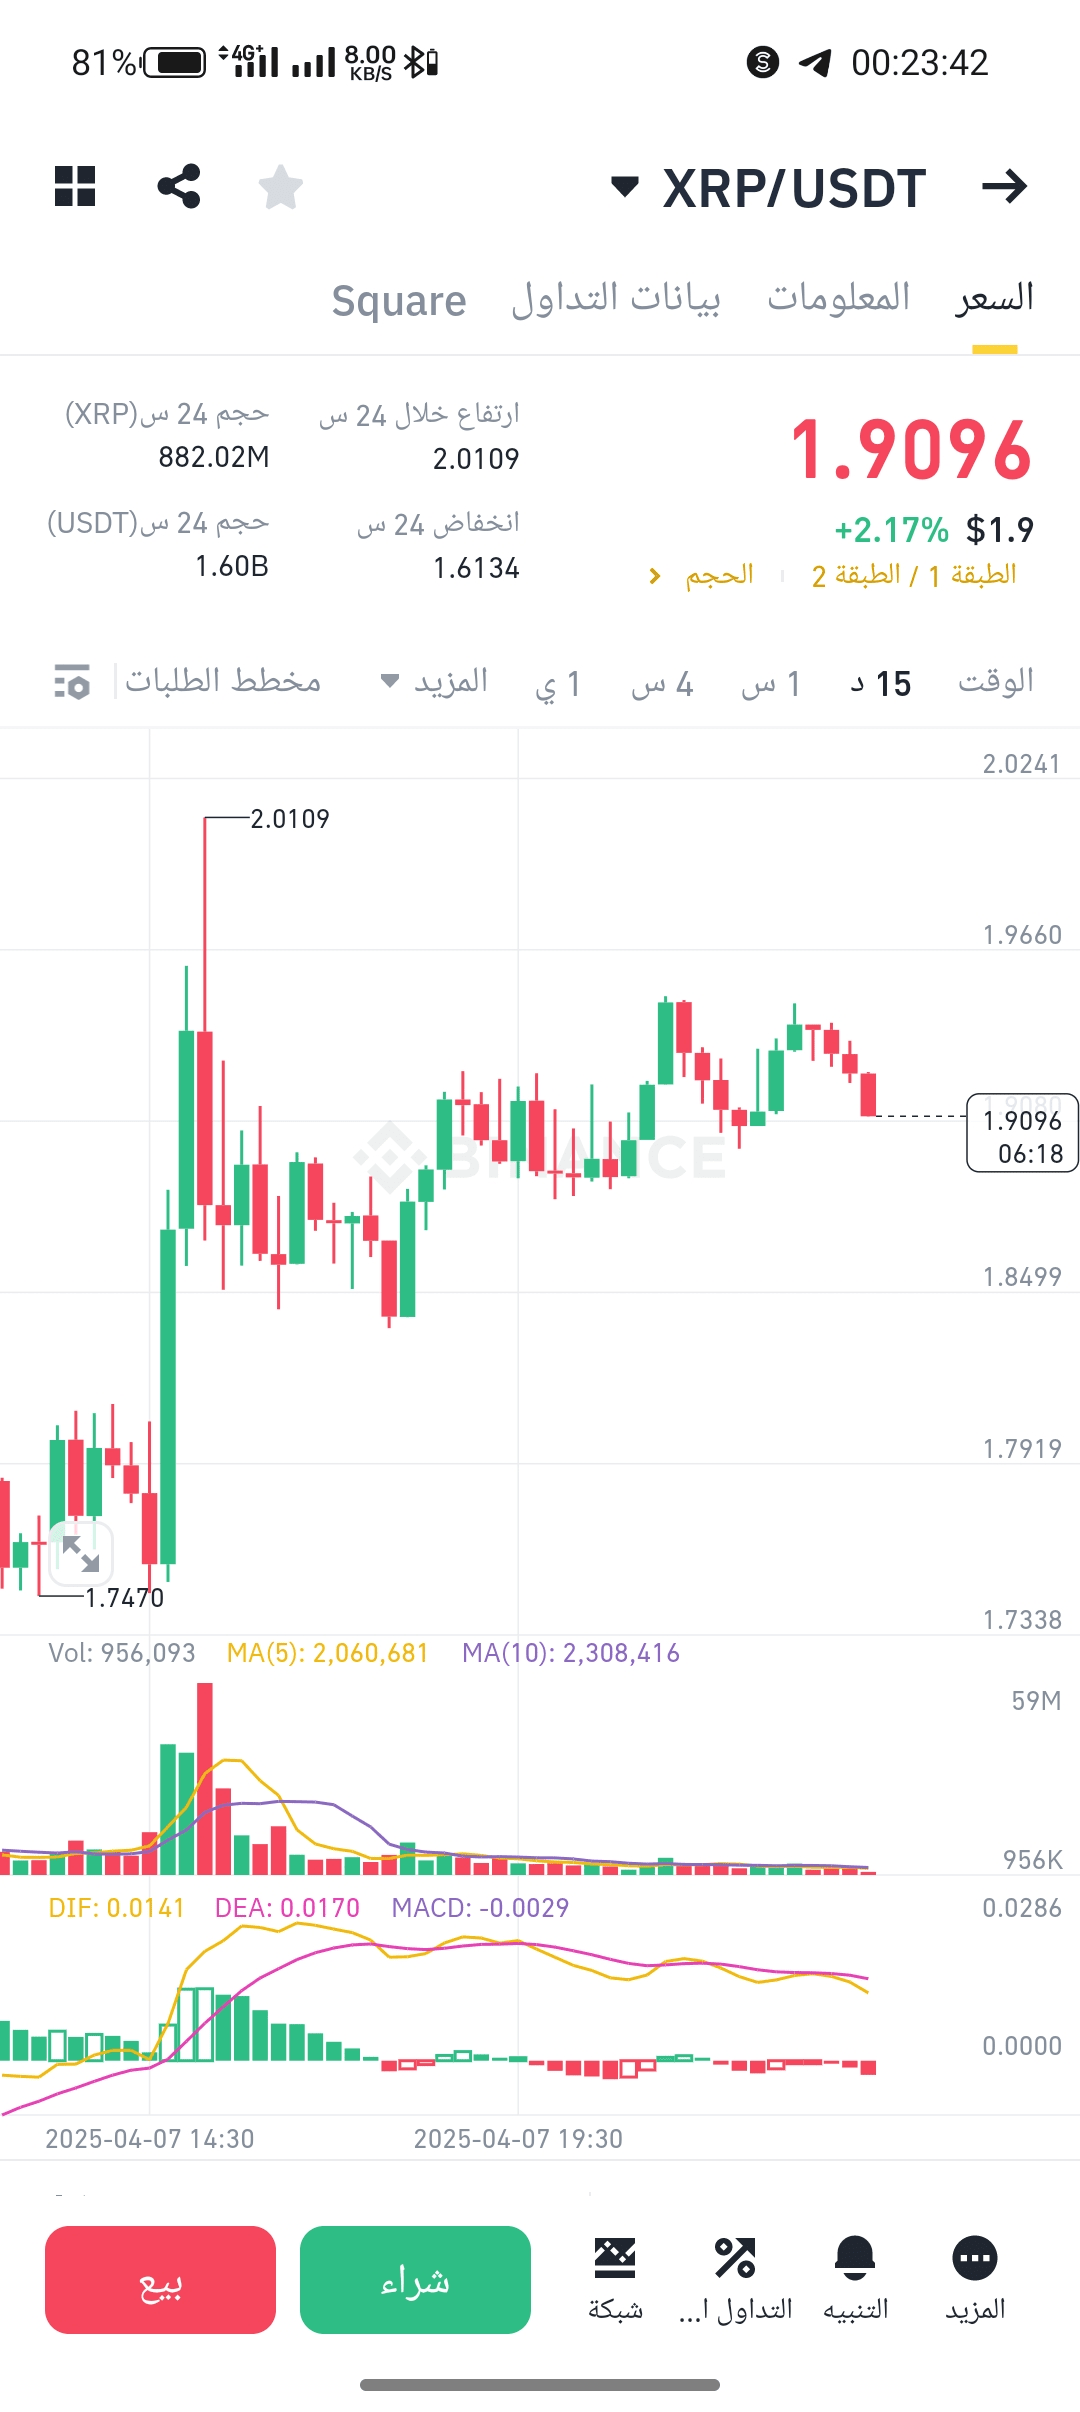
Current price: 1.9096
There was a rise to 2.0109 and a drop to 1.6134 over 24 hours.
The last candles are red (downward), indicating a slight decline in price after the rise.
Result: The trend is currently down in the short term (according to the last candles), but overall over 24 hours, the price is still up by +2.17%, indicating that the general trend has been upward.
1. General trend:
The price rose over 24 hours from 1.6134 to 1.9096, reaching a high point of 2.0109.
This means that the price is in an upward trend on the daily.
2. Candles (15 minutes):
In the last candles, we observe consecutive red candles, indicating a correction or slight decline after the rise.
This is normal after any significant rise, and it may be a buying opportunity at strong support.
3. MACD (below the chart):
MACD = -0.0029 (negative value): A signal of weak upward momentum currently.
The yellow line (DIF) and the purple line (DEA) are converging and heading downwards, indicating a temporary decline.
4. Moving Averages (MA):
MA 5 = 2,060,681 and MA 10 = 2,308,416
The shorter average (5) is below the longer average (10), indicating a temporary slowdown in the rise.
Summary:
The general trend is upward (throughout the day).
The short-term is down (slight decline or correction).
If you want to enter the market, it's better to watch if the price rebounds from strong support (like 1.85 or 1.80).
If the support is broken strongly, it may continue to drop a little.
Would you like me to tell you clear support and resistance areas? Or do you prefer analysis on a longer time frame (hour or 4 hours)?
#TrumpTariffs #RiskRewardRatio #BTCBelow80K #StopLossStrategies #DiversifyYourAssets