Relative Strength Index (RSI): A simplified explanation
What is the RSI indicator?
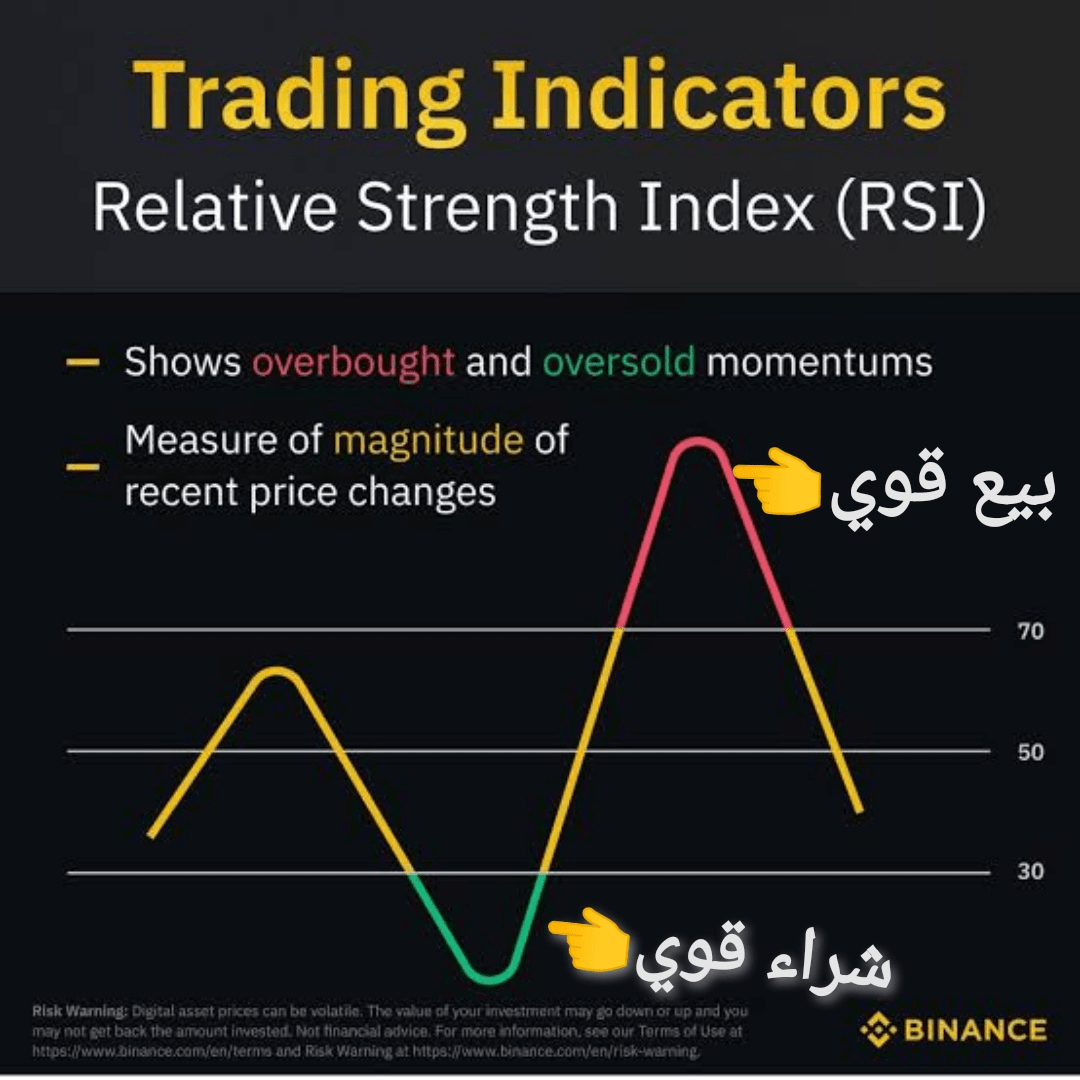
The Relative Strength Index (RSI) is a widely used technical analysis tool in trading. This indicator aims to measure the speed and change of price movements over a specific period. In other words, it measures the momentum behind price increases or decreases.
How does the RSI indicator work?
* Range: The RSI ranges from 0 to 100.
* Meaning:
* High readings (above 70): Indicate an overbought area, meaning the price may be too high and could be ready to drop.
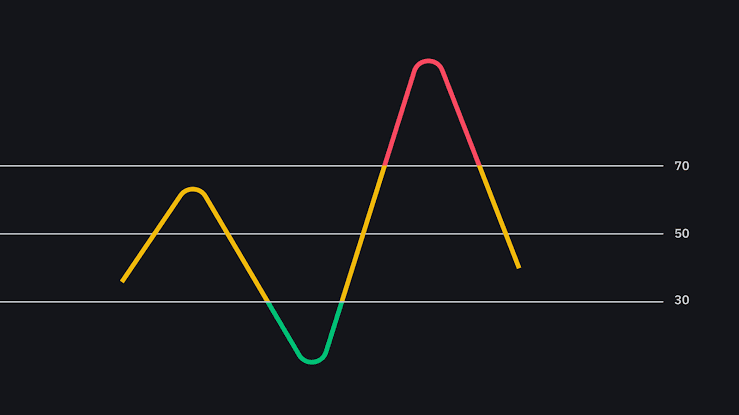
* Low readings (below 30): Indicate an oversold area, meaning the price may be too low and could be ready to rise.
* Reading around 50: Indicates a balanced market, where there is no strong buying or selling pressure.
Why do we use the RSI indicator?
* Identifying entry and exit points: The RSI can be used to identify entry and exit points from trades. For example, traders may look for selling opportunities when the indicator is in the overbought area, and vice versa.
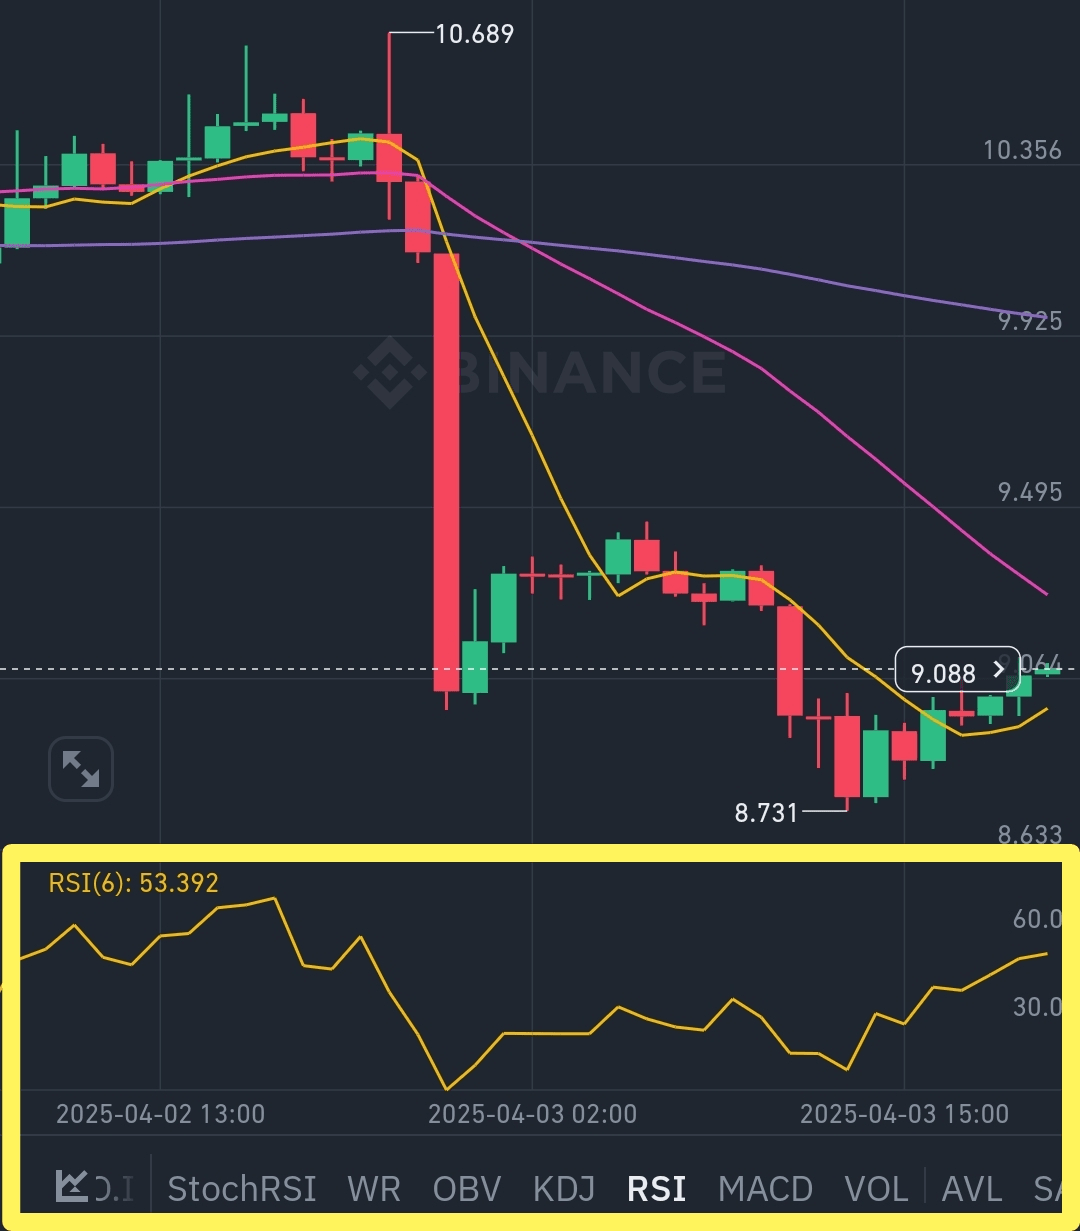
* Trend confirmation: The RSI can help confirm the overall price trend. If the indicator moves upward above the 50 level, it supports the idea of an upward trend.
* Predicting trend reversals: The RSI can indicate the likelihood of a trend reversal when the indicator exceeds overbought or oversold levels.
