Most traders think Bollinger Bands just show when price is “high” or “low”—but this indicator is actually a volatility cheat code that reveals market breakouts before they happen!
Let’s break it down step by step! 🚀
📌 Step 1: What Are Bollinger Bands? 🤔
✅ A volatility indicator that expands & contracts based on market movement.
✅ Consists of 3 lines:
• Middle Band = 20-period moving average (tracks trend direction).
• Upper Band = Acts as resistance during strong moves.
• Lower Band = Acts as support during strong moves.
✅ The wider the bands, the more volatile the market. The narrower the bands, the calmer the market.
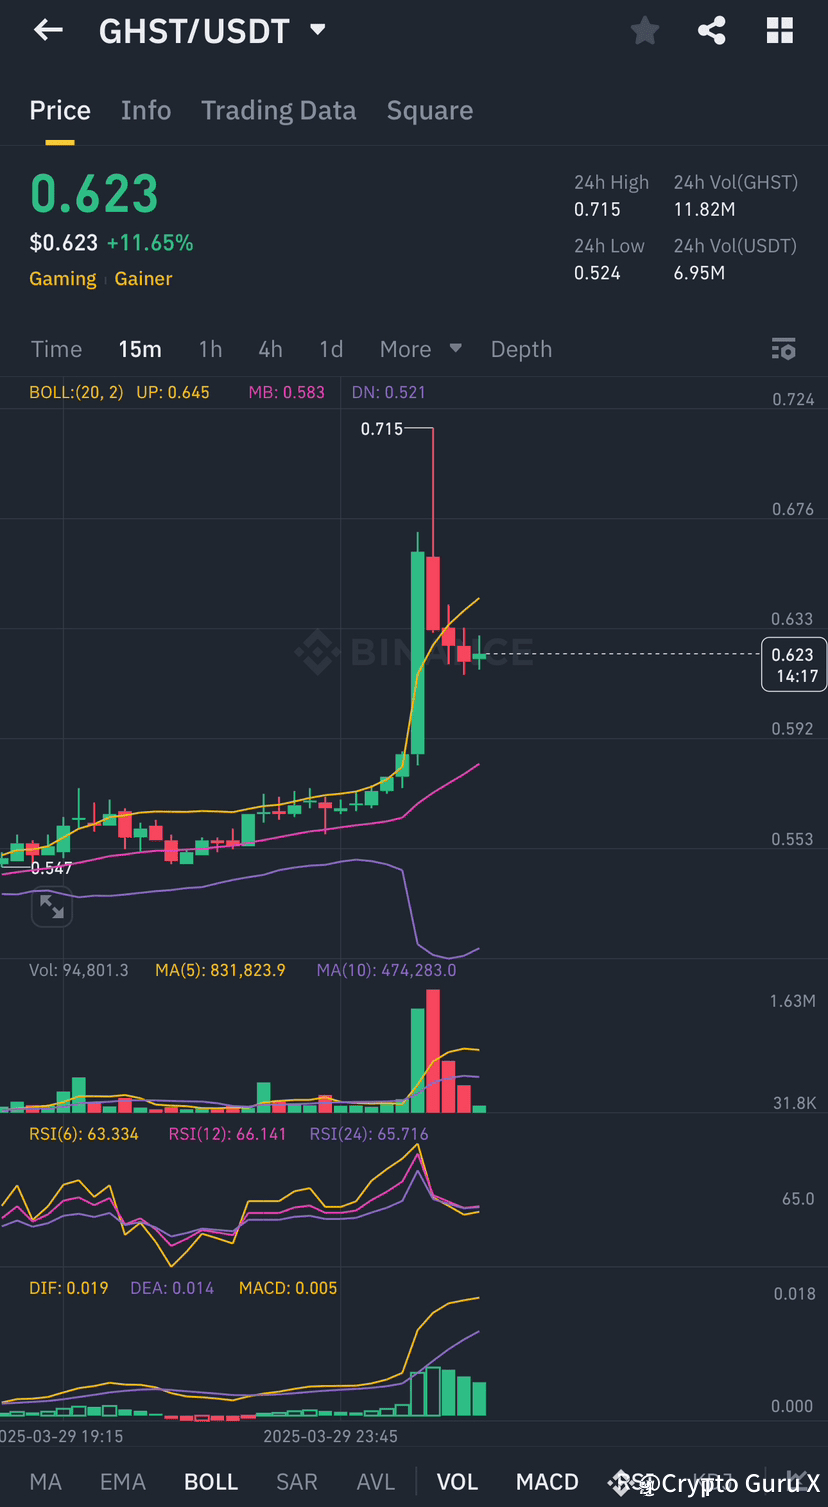
📌 Step 2: How to Set Up Bollinger Bands on Binance? ⚙️
🔹 Open Binance Chart → Indicators → Search “Bollinger Bands”.
🔹 Use default settings (20-period, 2 standard deviations) for most setups.
🔹 Adjust the period for short-term (10) or long-term (50) trading strategies.
📌 Step 3: How to Trade Bollinger Bands Like a Pro? 🎯
✅ Squeeze = Incoming Explosion! When bands contract, price is coiling up for a big move! 🚀
✅ Breakout = Trend Confirmation! A strong close outside the bands signals momentum continuation.
✅ Mean Reversion = Buy Low, Sell High! When price touches the lower band, watch for a reversal. When price touches the upper band, watch for a pullback.
✅ Riding the Bands in Trends! In strong uptrends, price hugs the upper band. In strong downtrends, price rides the lower band. Don’t trade against the trend!
⚠️ Pro Tip: Combine Bollinger Bands with RSI & Volume to avoid false signals!
💰 Binance’s advanced charting lets you customize Bollinger Bands to your strategy—are you using them yet?
💬 Have you ever used Bollinger Bands in your trades? Share your experience below! 👇
#BollingerBands #BİNANCE #KnowledgeIsPower