1. Market Structure and Key Levels
1. Price Dynamics and Technical Patterns
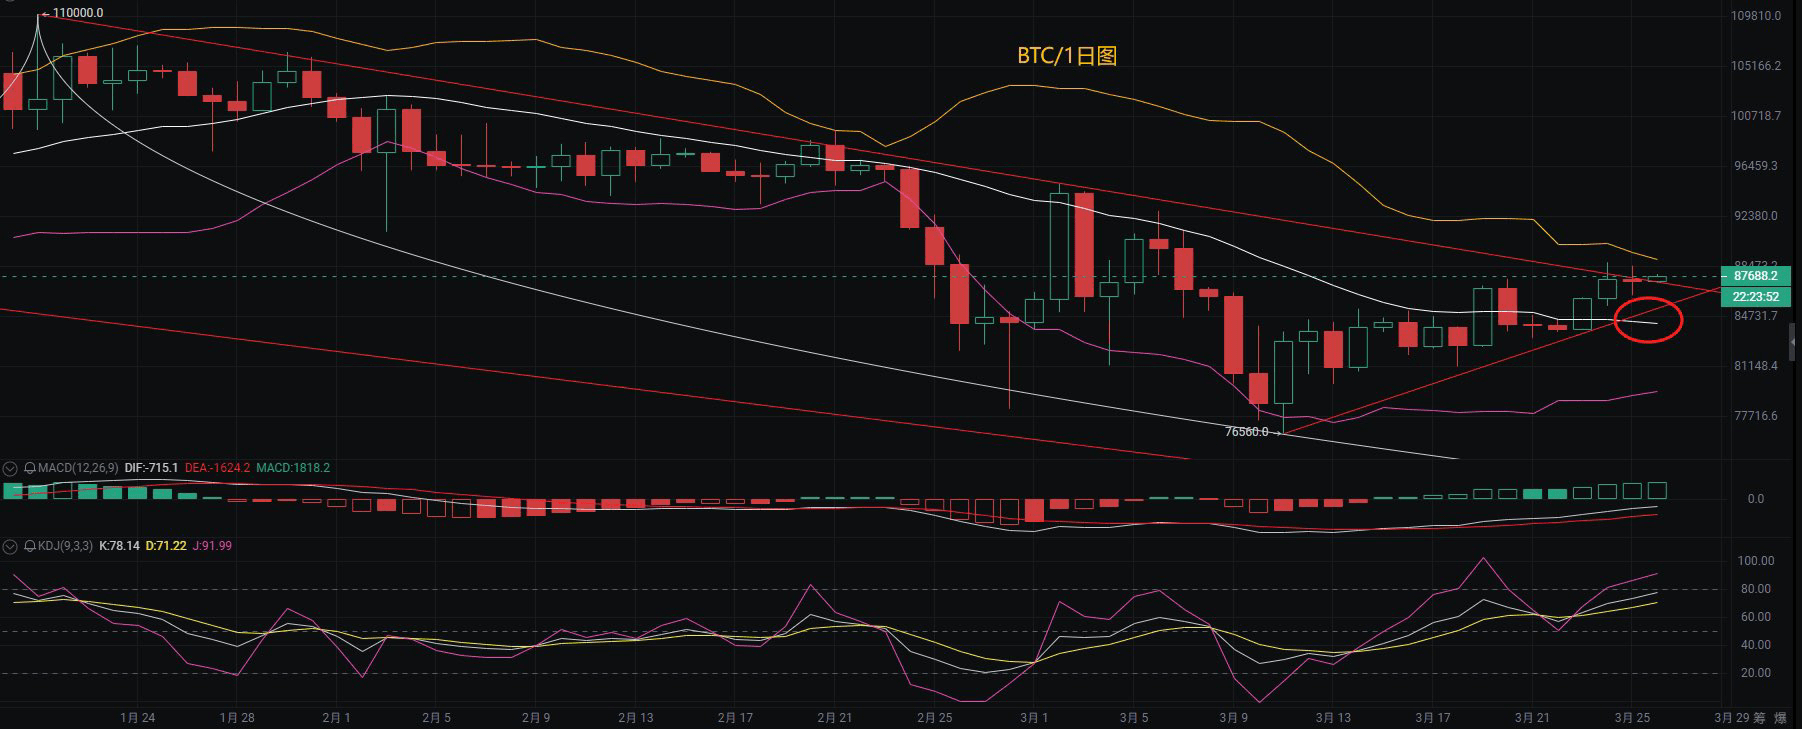
Bitcoin rebounded to $88,500 after testing the $86,200 support yesterday. Currently, the price is fluctuating around $87,000. On the daily chart, the price has not effectively broken through the previous high, and bullish momentum is weakening, suggesting a possible continuation of high-level consolidation in the short term.
• Support Levels: $86,000-$86,500 (hourly chart Bollinger Bands middle band, short-term strong-weak boundary)
• Resistance Levels: $88,500-$89,000 (previous high resistance area, daily Bollinger Bands upper band)
2. Technical Indicator Signals
• Daily chart level: The MACD bullish momentum bar is shrinking, and the RSI (56) is in a neutral range, indicating a lack of clear direction in the market.
• Hourly chart level: The Bollinger Bands are narrowing, with prices fluctuating around the middle band, and the KDJ lines are converging, indicating a high probability of continued consolidation in the short term.
• Pattern Characteristics: A range of $88,500-$86,000 has formed on the 4-hour chart, and a breakout may trigger a one-sided market.
⸻
2. Long/Short Game Focus and Market Catalysts
1. Short-Term Driving Factors
• Policy Expectations: The Trump administration plans to announce details of tariff adjustments on April 2, causing strong market caution. If the policies meet market expectations, it could boost risk asset sentiment and benefit Bitcoin.
• Whale Movements: The Mt. Gox exchange has recently transferred over $1 billion worth of Bitcoin, raising market concerns about selling pressure. However, on-chain data shows that institutions (like MicroStrategy) are still accumulating, mitigating some selling pressure.
2. Capital Flow and Market Sentiment
• ETF Fund Inflows: Bitcoin spot ETFs ended five consecutive weeks of net outflows, with a net inflow of $744 million last week, indicating a recovery in institutional investor confidence.
• Leverage Risk: The total open interest across contracts remains high, with shorts exceeding 60%. If the price falls below $86,000, it may trigger large-scale liquidations, further amplifying declines.
⸻
3. Operational Strategies and Risk Control Suggestions
1. Range Consolidation Strategy
Bullish Strategy:
• Re-test the $86,000-$86,500 support area with light positions to go long, targeting $87,500-$88,500, with a stop loss at $84,500.
• If breaking through $88,500, re-test and stabilize at $87,000 before going long, targeting $89,000-$90,000.
Bearish Strategy:
• Short positions in the $88,500-$89,000 resistance area, targeting $86,500-$86,000, with a stop loss at $90,000.
• If breaking below $86,000, go short, targeting $84,500-$83,500 (CME gap filling area).
2. Risk Control Key Points
• Position Management: No single position should exceed 5%, with a stop loss controlled at 1%-2%.
• Beware of false breakouts: If the price briefly breaks through support/resistance and then quickly falls back, decisively exit and wait for further developments to avoid chasing highs and lows.
⸻
4. Key Events and Long-Term Trends
1. Policy Implementation Window
Market uncertainty will gradually diminish after the tariff policy announcement on April 2.
• If policies are eased, Bitcoin may initiate a new round of upward movement.
• If policies are tightened beyond expectations, one should guard against the risk of a pullback to $83,500 or even $73,000.
2. Expectations for Technical Upgrades
Ethereum's Prague upgrade testnet deployment has been completed. If progress goes smoothly, it may drive ETH to break through the $2,100 resistance, indirectly boosting Bitcoin market sentiment.
⸻
Summary
Bitcoin remains in the $86,000-$88,500 range in the short term, with a focus on shorting high and buying low, following the trend after a breakout.
It is crucial to focus on policy implementation, whale selling pressure, and ETF fund flows, and to strictly set stop losses to prevent black swan events.
In the medium to long term, Bitcoin is still supported by the halving cycle, institutional accumulation, and macro liquidity. If it pulls back below $83,500, it can be seen as a long-term positioning opportunity.