After the weekend, Bitcoin rebounded with a fluctuating trend instead of a decline. The low long position we set up on Friday has also perfectly gained good space.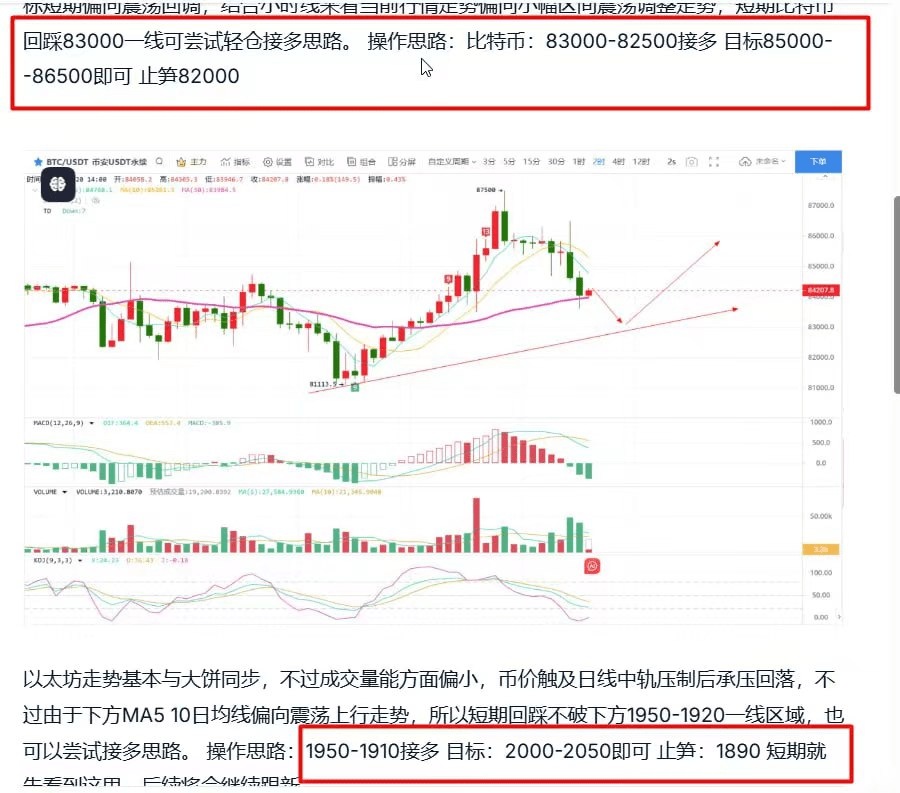
The current weekly K update shows that Bitcoin is fluctuating around the MA30 daily moving average after the update. Although the MA5 and MA10 moving averages slightly press down on the price, the lower Bollinger Band continues to rise. Coupled with the MACD and K DJ indicators showing a contraction in bearish sentiment, if bulls exert strength again this week, Bitcoin will test the resistance of the weekly K MA10 moving average again, with price reference around 92000.
From the daily perspective, Bitcoin is once again running above the middle line of the Bollinger Band and the MA30 daily moving average. The MA5 and MA10 moving averages show a slight upward trend in the short term. Looking at the indicators, the short-term bullish sentiment is strong. Combining with the 12-hour chart, the current price is fluctuating upwards relying on the upper line. The MA30 daily moving average has started to turn upwards, and the short-term 84000 level has become a support. If the price cannot break this support upon retracement, it will head towards the upper line of the daily chart at the 90000 mark.
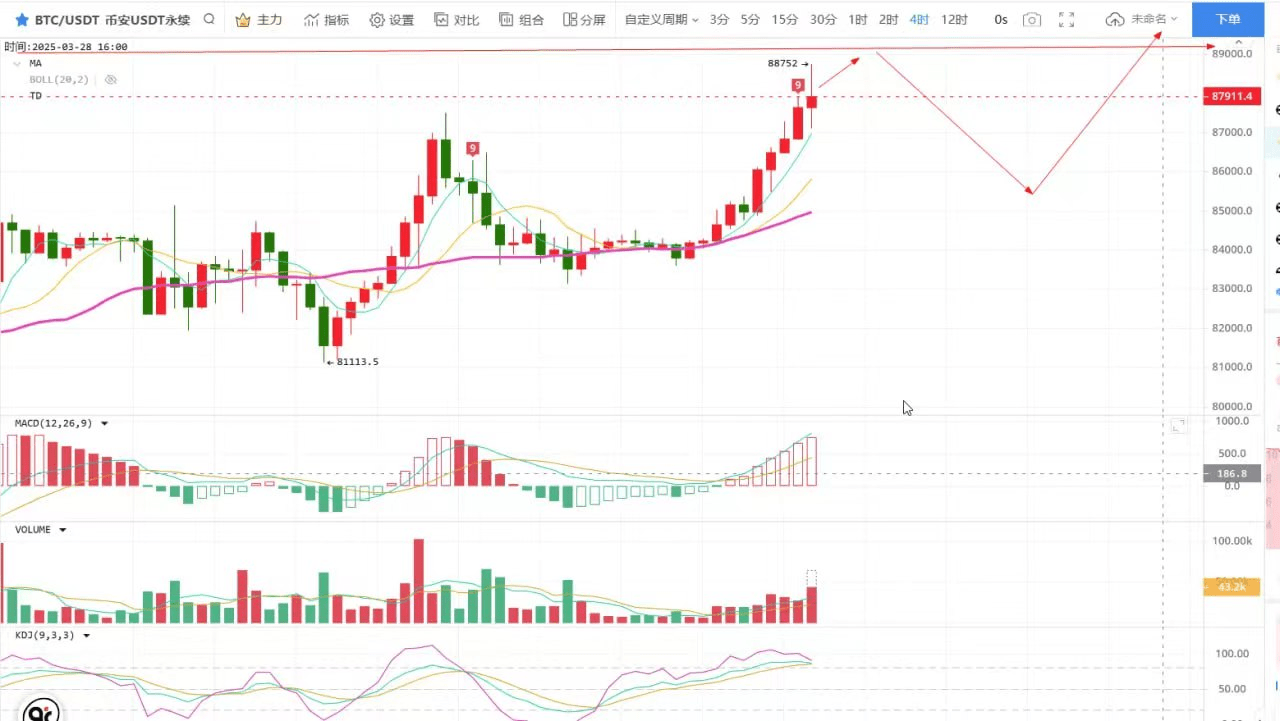
The current K bar on the 4-hour chart has five consecutive positive candles, and the TD indicator has reached TD 9 before lagging again. The price is currently fluctuating upwards while stepping on the MA5 daily moving average, indicating an increased probability of the TD indicator lagging to TD13. Judging from the hourly chart, the current indicators are lagging significantly, and the short-term trend leans towards a slight upward fluctuation. However, there is still some resistance around the 90000 mark on the daily chart, so in the short term, we are bullish but not chasing the rise. We will wait until the price rebounds near resistance before lightly positioning for short thoughts, and enter long positions upon correction.
Trading strategy: Bitcoin: Short from 88700 to 89500. Target: 87000 to 85000. Stop loss: 90000.
The trend of Ethereum basically synchronizes with Bitcoin, but the trading volume is relatively small. The price is about to touch the resistance of the MA30 daily moving average, and the overall trend is weaker than Bitcoin. Therefore, the short-term strategy remains to position for shorts on rebounds at high levels.
Trading strategy: Short from 2095 to 2120. Target: 2060 to 2010. Stop loss: 2135.
For the short term, let's see here first. Updates will continue later.

