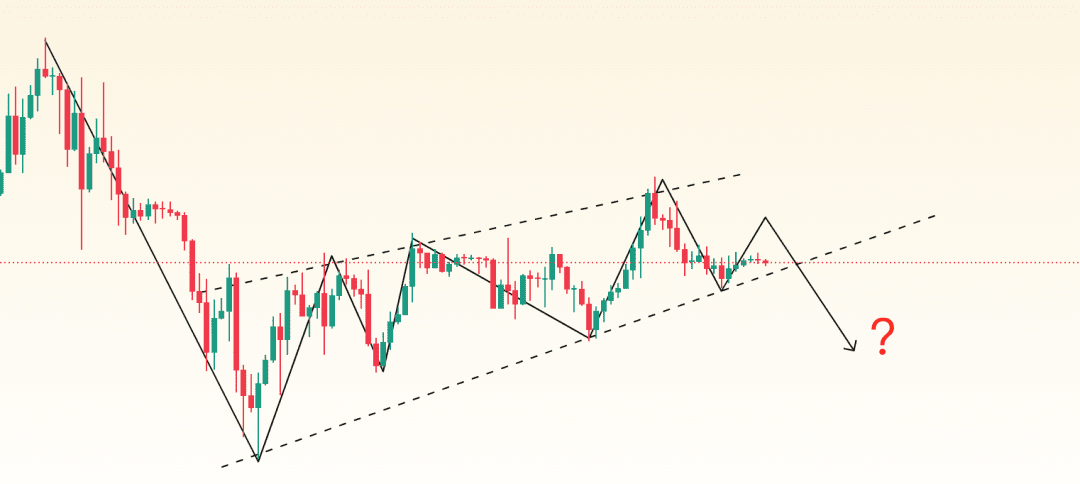
Bitcoin currently has a potential bearish wedge pattern. Can it move like this? That remains a question. However, it is clear that a one-sided market has not yet arrived, and it is advisable to take profits when possible.
Bitcoin (BTC) Trend Analysis
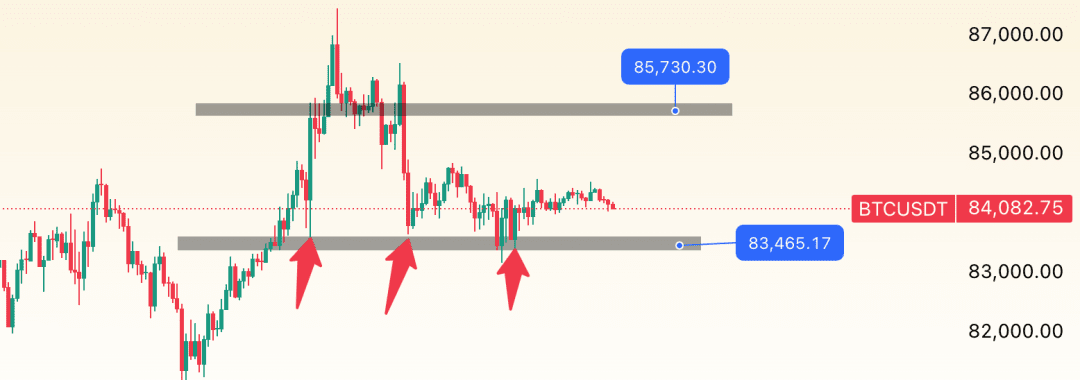
From the BTC 1-hour candlestick chart, the price is currently around $84,000, showing a fluctuating consolidation trend. Both upward and downward movements in the market are constrained by important support and resistance, preventing the price from forming a clear one-sided trend.
Key Support and Resistance
Short-term support zone: $83,300 - $82,500
Short-term resistance zone: $85,500 - $86,400
Recently, the BTC price has tested the support around $83,300 three times without breaking it, indicating strong buying interest in this area. This position resonates with Fibonacci 0.618; while the upper zone at $85,400 is a high trading volume area with significant selling pressure. If it cannot break through, it may continue to maintain a range-bound oscillation in the short term.