Classification of buy and sell points
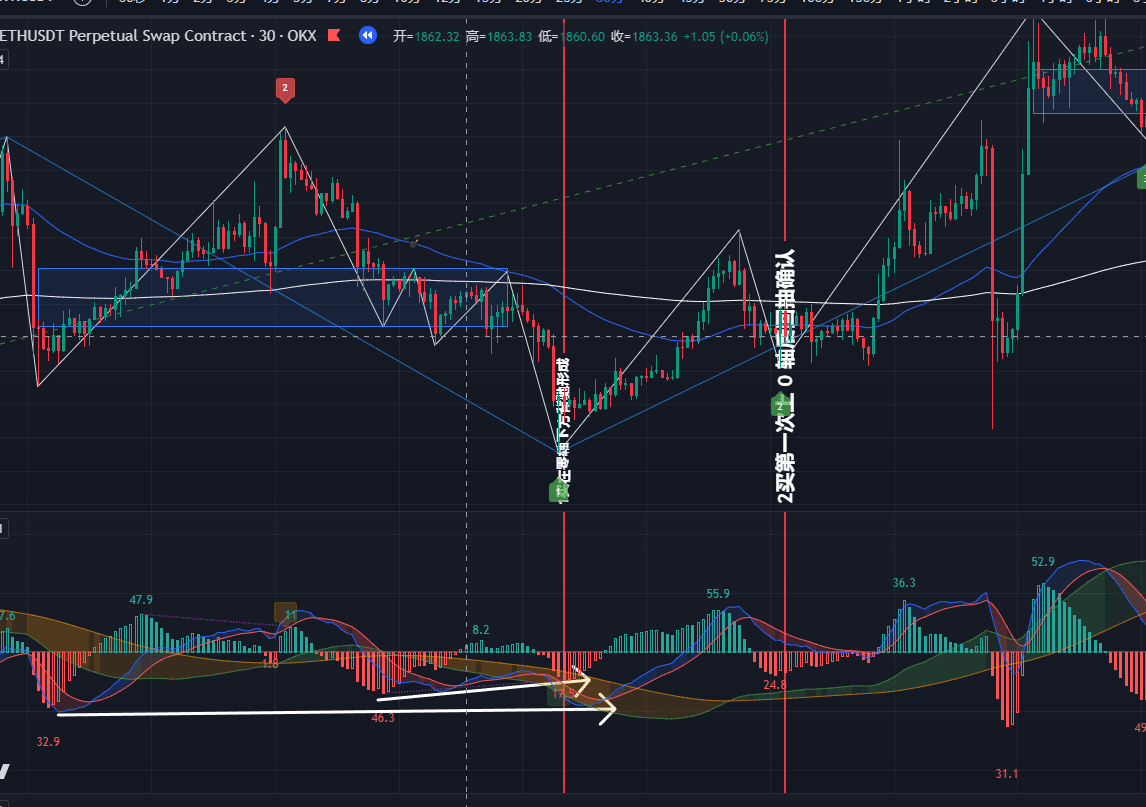
- First type of buy point: formed when divergence occurs below the 0 axis.
- Second type of buy point: formed after confirming the pullback after the first rise above the 0 axis.
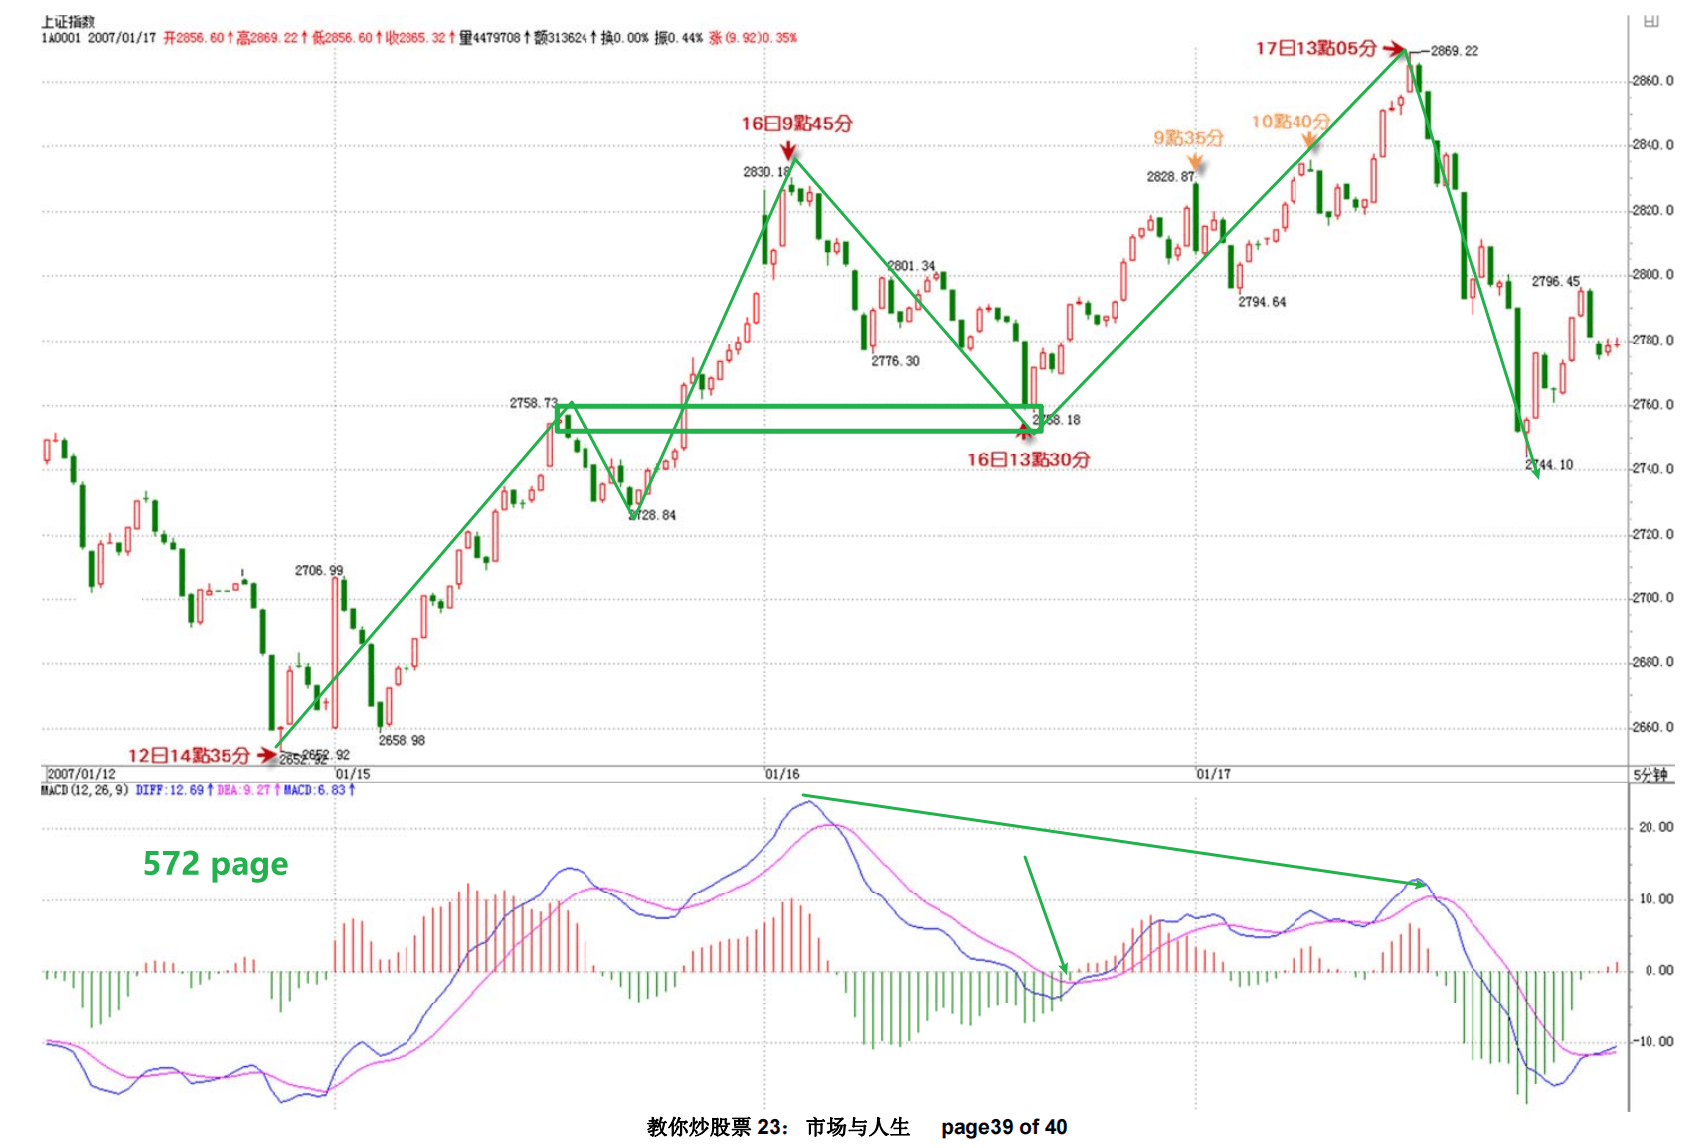
- First type of sell point: formed when divergence occurs above the 0 axis.
- Second type of sell point: formed after confirming the rebound after the first drop below the 0 axis.
Note: Identifying divergence is the foundation of Chande theory.
Two forms of MACD
1. Divergence of yellow and white lines: used to capture divergence segments.
2. Divergence of the area of red and green bars: used for precise strikes in divergence segments.
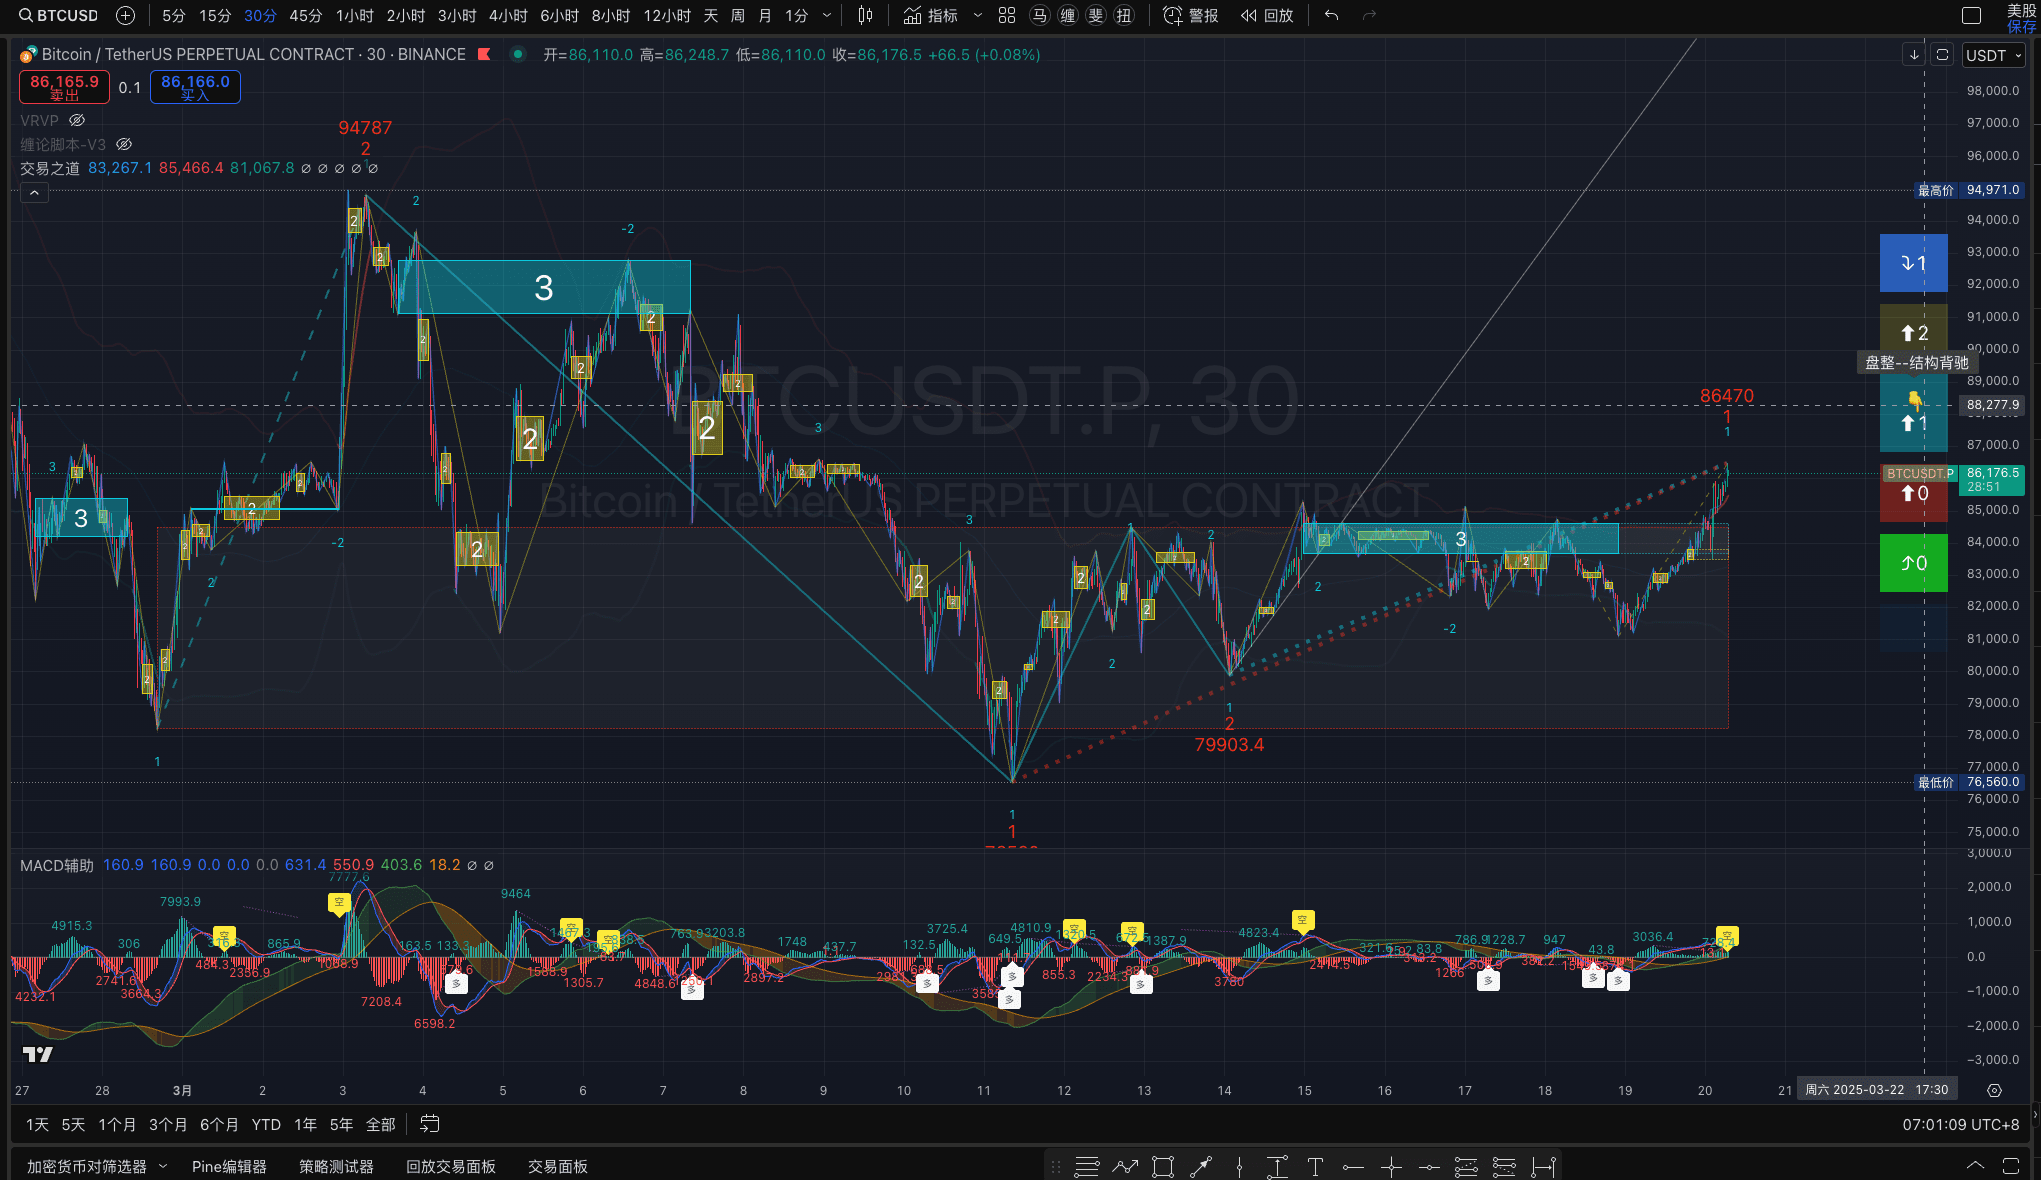
MACD as an auxiliary judgment method
- The strength of the moving average's rise is more important; MACD only serves as an auxiliary.
- The key of MACD is the comparison between segments.
- When the current red or green bars cannot continue to extend and start to shorten, it needs serious attention.
- Don't wait until the red bars turn into green bars or vice versa, otherwise the reaction is too slow.
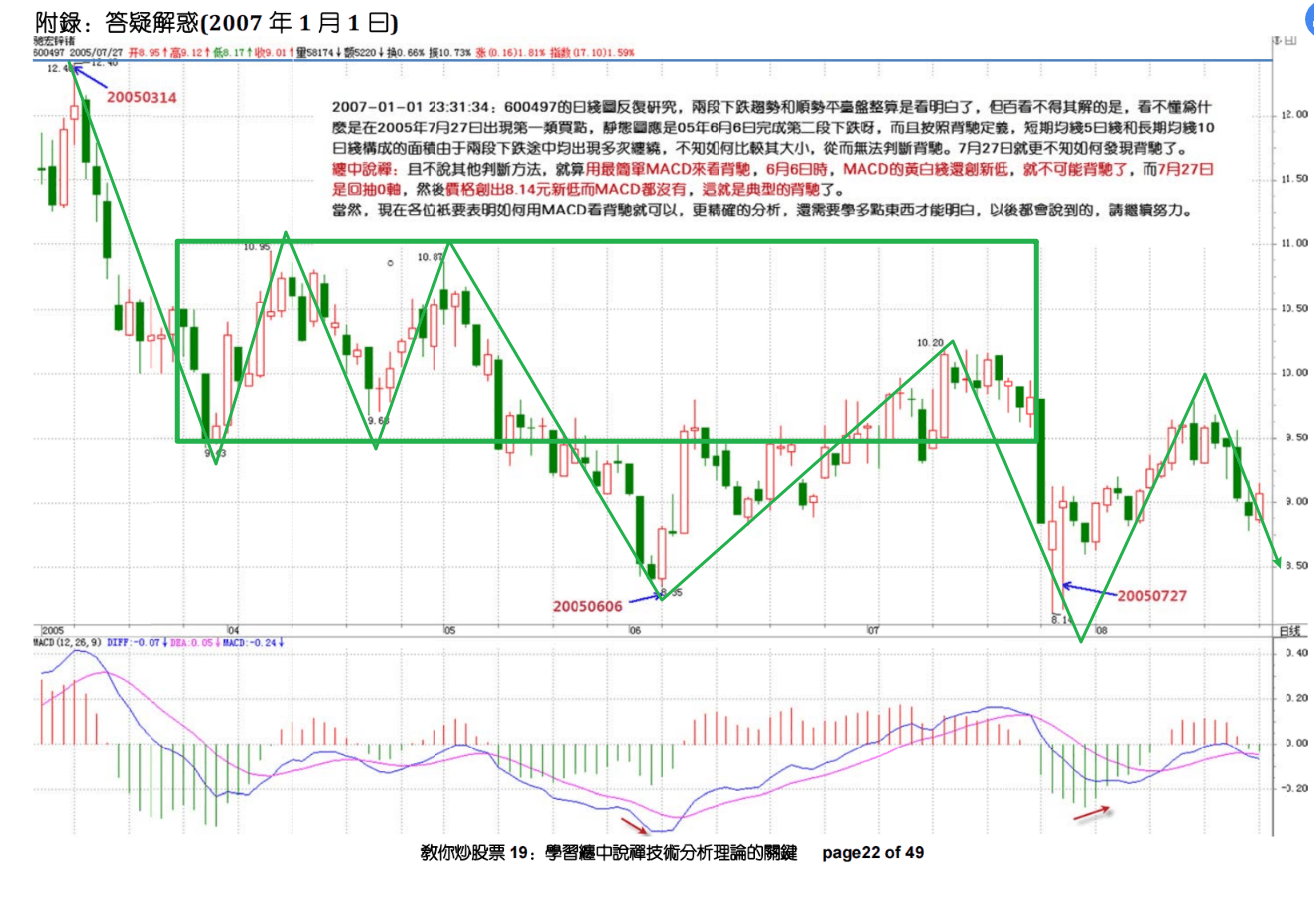
Judgment method of divergence
1. Comparison of two segments with the same direction trend
2. Key points when using MACD as an auxiliary
- The pullback process generated by connecting the types of trends of two trends at the 0 axis.
- The divergence that appears afterwards is the valid one.
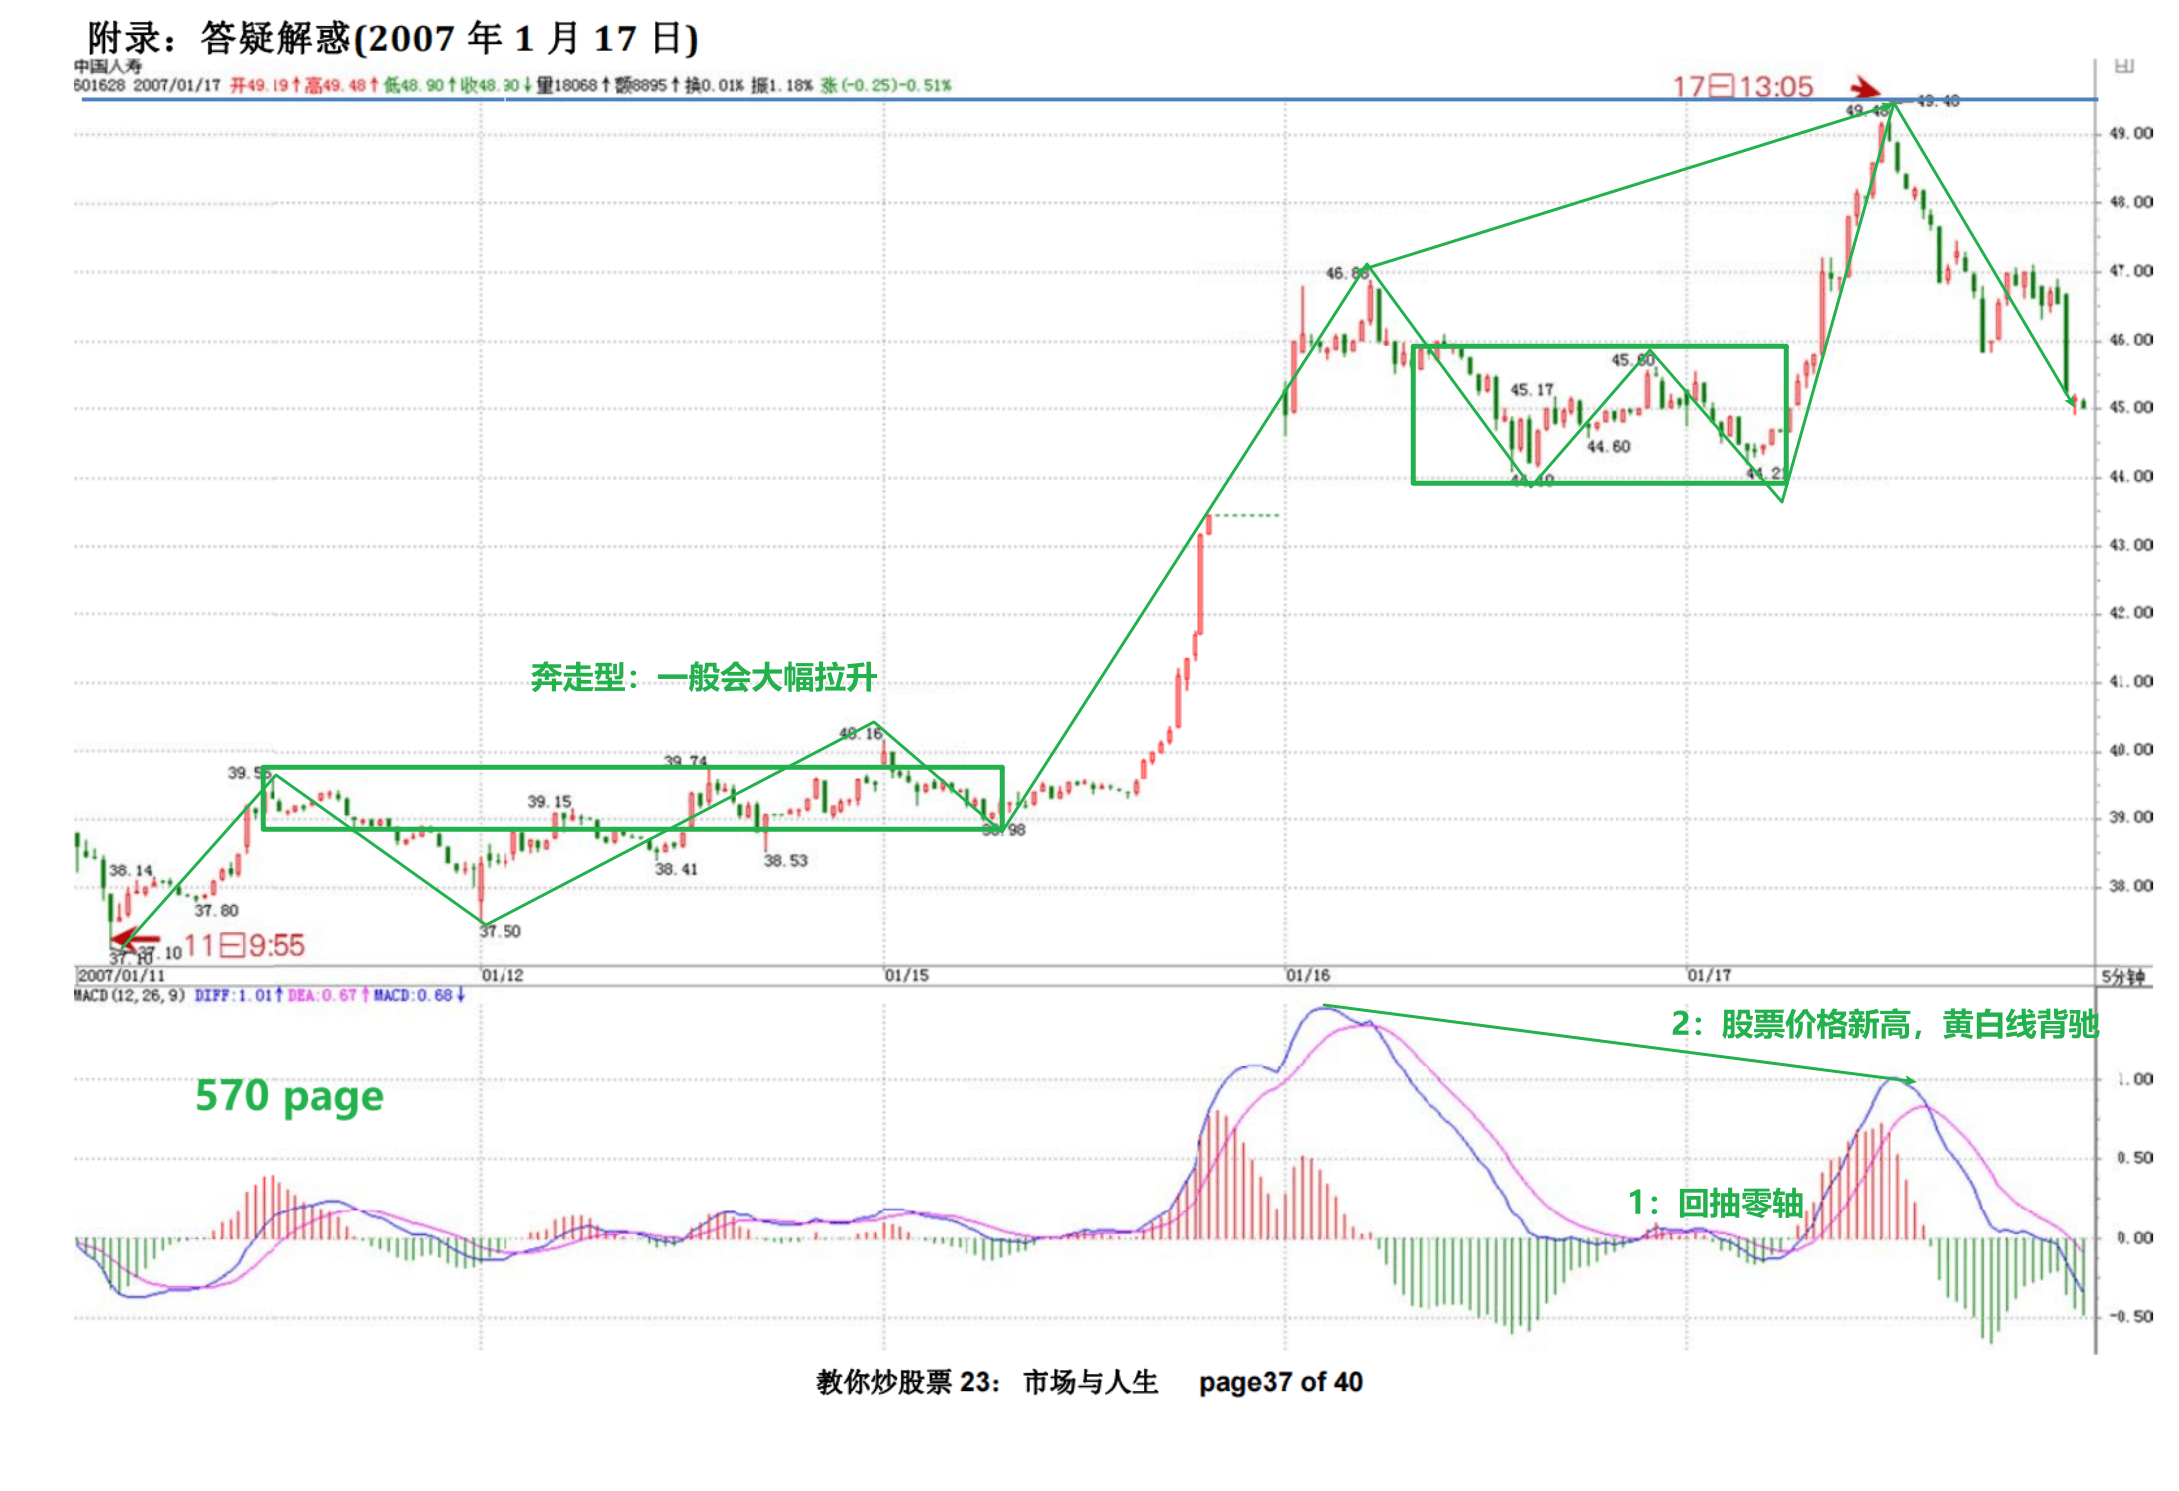
- The most effective divergence:
- The yellow and white lines return to the vicinity of the 0 axis and then go up.
- Stock price reaches a new high, while the yellow and white lines and bars do not reach new highs; divergence that appears at this time is the most effective.
Key points of MACD
1. The relationship between a wave of red and green bars and the turning points in the wave.
- Each wave of red and green bars is like a small mountain, the peak is where the turning point is.
2. Judgment of the yellow and white lines
- Above the 0 axis: bullish market.
- Below the 0 axis: bearish market.
Note: This point is consistent with the notion of chaotic trading.

Divergence segments do not necessarily occur in divergence situations
This situation is relatively common.
If using MACD as an auxiliary judgment:
- After pulling back to the 0 axis and then going up, it can be regarded as entering the divergence segment.
- Whether the yellow and white lines reach new highs cannot be known when just coming out.
- The key is to look at the structure of the small scale:
- If the small-scale trend is particularly strong, causing the yellow and white lines to reach new highs, there is no divergence issue.
$BTC #缠论脚本
