
"No matter what sins you committed in your past life, as long as you buy Ethereum, you have paid it off." This is the most heartbreaking joke I've heard, expressing the bitterness and helplessness of ETH holders in this cycle. I originally didn't want to write about ETH data because I know many friends hold it. Moreover, the funds are not too small, as it is one of the two cryptocurrencies that have gone through spot ETFs; everyone is willing to take positions.
The current fragile consensus foundation of ETH is on the verge of collapse in the storm, and it cannot withstand any more tossing; I do not want my analysis to affect everyone's mood. However, many friends in the comment section often ask me to write about it.
After careful consideration, let's take a look from the perspectives of 'cost basis' and 'behavior performance.'
Cost Basis Distribution (CBD) is a heat map with fixed price levels over a selected time period, clearly showing how the cost basis of chips changes over time. Since it calculates the average cost for each address, it better reflects the behavior of holding individuals.
(Figure 1)
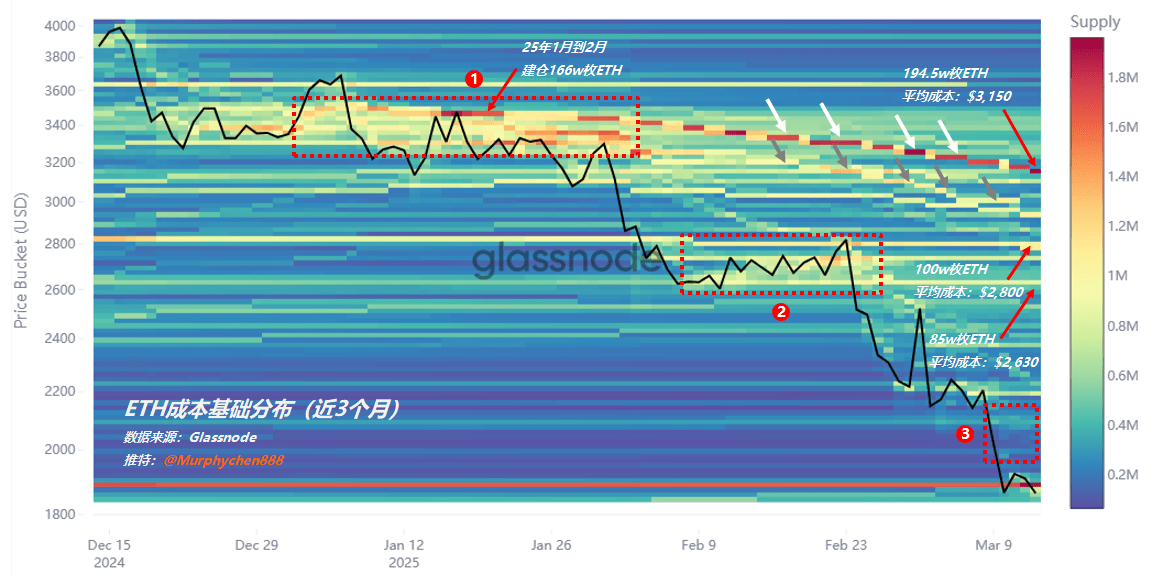
Figure 1 shows the CBD data of ETH over the past three months. First, we can see a dense chip accumulation area marked by the red dashed box at label 1. These addresses were built between January and February 2025, with a holding cost roughly between $3,200 and $3,500. In particular, there is a cluster of 'red' addresses that increased their holdings at $3,475, totaling 1.66 million ETH.
This group did not sell during the process when ETH fell to $1,900; instead, they have continuously increased their positions and currently hold 1.94 million ETH, reducing their cost to $3,150 (as indicated by the white arrow in the figure). At the same time, the yellow stepped-down line indicated by the gray arrow in the figure shows that other addresses in the chip accumulation area have also lowered their average cost through various degrees of replenishment during the decline.
Looking again at the red dashed box marked as label 2, there is also a chip accumulation area, but its overall scale is smaller than the one above. These chips were built in mid-February 2025, with a cost roughly between $2,600 and $2,800. However, as ETH's price fell below $2,300, they began to cut losses and reduce positions, and so far, a lot has been sold. Only the chips at the price levels of $2,800 and $2,630 remain unchanged, holding 1,000,000 and 850,000 ETH respectively.
Below this point, the new demand for ETH has gradually weakened, especially after the price fell below $2,000. According to the data, there is almost no new purchasing power (as indicated in the figure with label 3).
However, anyway, those investors trapped at high positions who actively increased their holdings during the price decline can be said to be believers in ETH (at least for now), and they are the real purchasing power in the market.

(Figure 2)
Next, we will extend the time span to look at the holding costs and behavior of earlier investors. In the red dashed box marked as label 1, there are a group of addresses that started building positions in July-August 2023, holding nearly 3.3 million ETH at the peak, with an average cost of around $1,850. Throughout the process of ETH rising to $4,000 and then falling back to $1,860, they gradually sold off, leaving 1.6 million ETH by March 10 (then they started to increase positions again on March 13 and currently hold 2.12 million ETH).
They can be said to have gone through a roller coaster, but fortunately, they took profits in batches. The current price is just at their cost line from two years ago. Theoretically, as long as the above address cluster does not sell anymore, and the 2.12 million chips here remain intact, then around $1,850 should be an effective support level.
The strongest selling pressure comes from lower-cost chips (see the red dashed box at label 1); these are the chips built in September-October 2023, with an average cost of around $1,560, holding nearly 3.2 million ETH at the peak. They cashed out most of their positions during this roller coaster, currently only holding 610,000 ETH; it can be said that they are the biggest winners of this cycle playing ETH.

(Figure 3)
From the overall data of the past three years, when ETH's price was at $1,300/$1,600/$1,800, there were dense chip accumulation areas (marked as labels 1-4 in the figure). This indicates that the consensus basis of ETH at this time was still quite good, with a large amount of funds willing to buy ETH at these positions. But for some reason, after July 2024, these low-cost long-term chips began to cash out, especially the chips at $1,600 that crazily cashed out.
If it was just for profit-taking, it could be understood. But the most critical point is that afterward, there has not been a decent chip accumulation area formed at high positions (as indicated by the white dashed box in the figure). From the chip structure, ETH lacks a solid safety cushion; the market does not have enough new demand to absorb the excess supply. Once supply and demand become unbalanced, it cannot form effective support.

(Figure 4)
As the saying goes, without comparison, there is no harm. Let's look at the data for BTC to find essential differences.
BTC has created chip accumulation areas in the ranges of $15,800-$16,900 and $26,000-$29,000, and as the price rises, these chips will also be sold (as indicated in the figure with labels 1/2). However, the difference is that when low-cost BTC is sold, new chip accumulation areas are formed again at high positions (as indicated in the figure with labels 4/5, with the current highest chip accumulation area around $97,000).
In particular, we can also see that the chips built around BTC $39,000 in April 2022 are still being held (as indicated in the figure with label 3, 360,000 BTC), remaining unmoved whether it drops to $15,800 or rises to $108,000.
This truly shows consensus and faith! No matter how high the price, there is always capital willing to support.
-------------------------------------------------
Written at the end...
For investors buying ETH in this cycle, it seems like a life-and-death ordeal in the crypto world! From a high of 56% drop from 2024 to 2025, not only has it caused investors great suffering, but it is also on the brink of life and death.
The high-position trapped chips have seemingly exhausted their purchasing power after a series of self-rescue replenishments; the current price touching $1,850 is also the cost price where a group of large holders built their positions two years ago. When the price fell here, they began to replenish (buying back the previously sold high positions to average the cost), thus forming a support effect. If it cannot hold here, it may head straight for $1,600 and $1,250 below, which are the remaining support levels from three years ago.
From the overall behavior of investors, the most important thing is the reconstruction of consensus on ETH's value. Once the large holders lose faith, the chips trapped at high positions such as $2,630 (850,000 pieces), $2,800 (1,000,000 pieces), and $3,150 (1,945,000 pieces) will all become heavy resistance on the road to rebound.
Writing to this point should come to an end. I can only share the data I see; it does not represent my bullish or bearish view on ETH. Friends, please view it rationally.
My sharing is only for learning and communication and not as investment advice.