That "Ready-to-Short" weekly candle
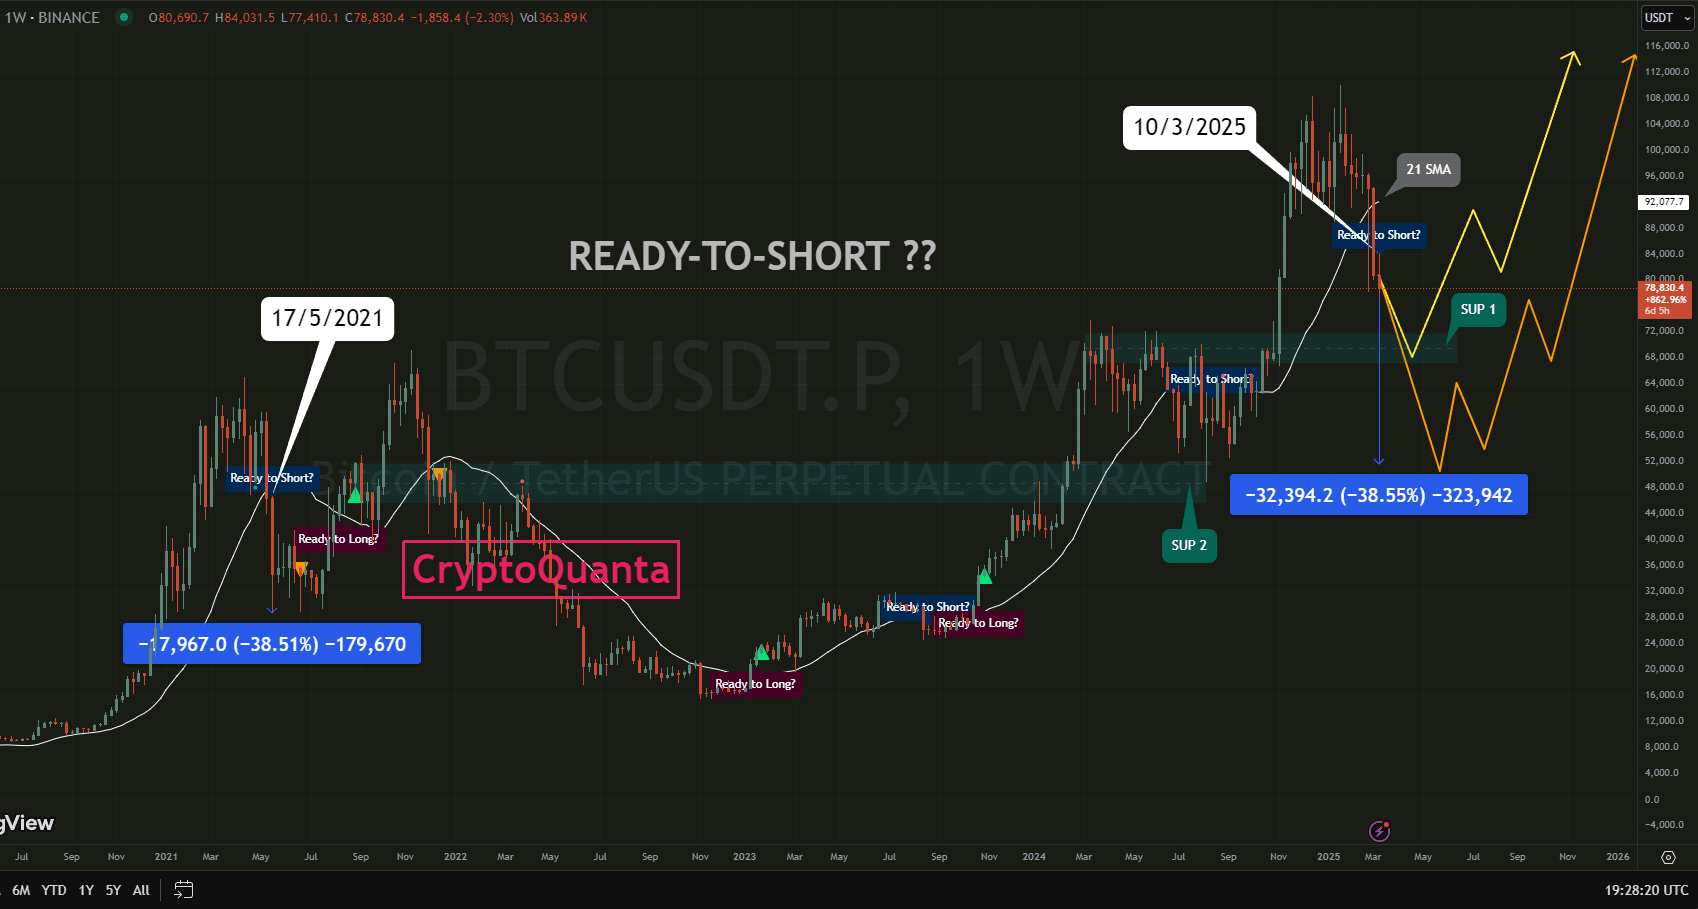
It was 17/05/2021, an Algorithm detected a weekly candle as "Ready to Short".
Current weekly candle also getting early/blinking signal of "Ready to short" as you can see in the attached picture.
If we look at the other factors, Candle pattern and SMA 21 are also showing a very clear similar picture.
What about NEWS?
Ohhhhhhhhhh, its crazy. So, are you ready see a bloody week as previous week?
What do you think?
Will this weekly candle be the same as the date of 17/05/2021 weekly candle which was -38%? Let me know in the comment section.
What now?
As the price has climbed very high, it has a very high chance to drop. If the price drops, there are 2 strong supports has shown in the picture. If you want to trade, I suggest you that you can mark those support range in your chart and see how price reacts.
Next 2-3 weeks can be tricky. Stay tune for any further update about it.
BTCUSDT price 78.8K at the time of writing.
Thank you!