I. Principles of the MACD Trading System
Composition of MACD
MACD consists of three parts:Fast Line (DIF): The difference between the short-term EMA (typically 12 days) and the long-term EMA (typically 26 days);
Slow Line (DEA): The M-day exponential moving average of DIF (typically 9 days);
Histogram: The difference between DIF and DEA, reflecting the distance between the fast and slow lines.
Core Logic
Trend Identification:
DIF and DEA are above the zero axis: Bullish trend;
DIF and DEA are below the zero axis: Bearish trend.
Momentum Analysis:
Histogram enlarges: Momentum strengthens;
Histogram shrinks: Momentum weakens.
Buy and Sell Signals:
Fast and slow line crosses;
Histogram changes;
Zero axis breakthroughs.
Applicable Market Conditions
Trending Market: MACD performs excellently in trend identification;
Sideways Market: MACD may generate more false signals.
II. Construction of the MACD Trading System
Fast and Slow Line Cross Strategy
Buy Signal: DIF crosses above DEA (Golden Cross) and is above the zero axis;
Sell Signal: DIF crosses below DEA (Death Cross) and is below the zero axis;
Stop Loss: Price falls back to recent lows (buy) or rises to recent highs (sell).
Zero Axis Breakthrough Strategy
Buy Signal: DIF and DEA break through the zero axis from below;
Sell Signal: DIF and DEA break below the zero axis from above;
Stop Loss: Price falls below the zero axis (buy) or rises above the zero axis (sell).
Histogram Momentum Strategy
Buy Signal: Histogram turns positive from negative and gradually enlarges;
Sell Signal: Histogram turns negative from positive and gradually shrinks;
Stop Loss: Histogram turns negative again (buy) or turns positive again (sell).
Position Management
Risk for a single trade controlled within 1%-2% of total capital;
After confirming the trend, positions can be added in batches.
III. Optimization of the MACD Trading System
Parameter Adjustment
Fast Line Period (12 days):
Shortened Period (e.g., 6 days): Sensitive, suitable for short-term trading;
Extended Period (e.g., 24 days): Stable, suitable for long-term trading.
Slow Line Period (26 days):
Shortened Period (e.g., 13 days): Sensitive;
Extended Period (e.g., 52 days): Stable.
Signal Line Period (9 days):
Shortened Period (e.g., 5 days): Sensitive;
Extended Period (e.g., 12 days): Stable.
Combine with Other Indicators
RSI: Filters overbought and oversold signals to improve win rate;
Bollinger Bands: Confirms price volatility range;
Volume: Confirms trend strength.
Multi-Time Frame Analysis
Large Cycle (e.g., daily) to assess overall trend;
Small Cycle (e.g., 1 hour) to find specific entry points.
IV. Precautions
Lagging Issues
MACD is based on moving averages; signals lag behind price changes and may generate false signals at the end of trends.Solution: Combine with leading indicators (such as RSI) or price action analysis.
Risks in Sideways Markets
In sideways markets, MACD may frequently generate golden crosses and death crosses, leading to losses.Solution: Add trend filter conditions (such as zero-axis position) or switch to a ranging strategy.
Parameter Over-Optimization
Overfitting historical data may lead to poor performance of the system in the future.Solution: Use out-of-sample data testing to ensure system robustness.
Psychological Discipline
Strictly enforce stop-loss to avoid holding losing positions;
Accept the inherent losses of the system and pursue long-term positive expected value.
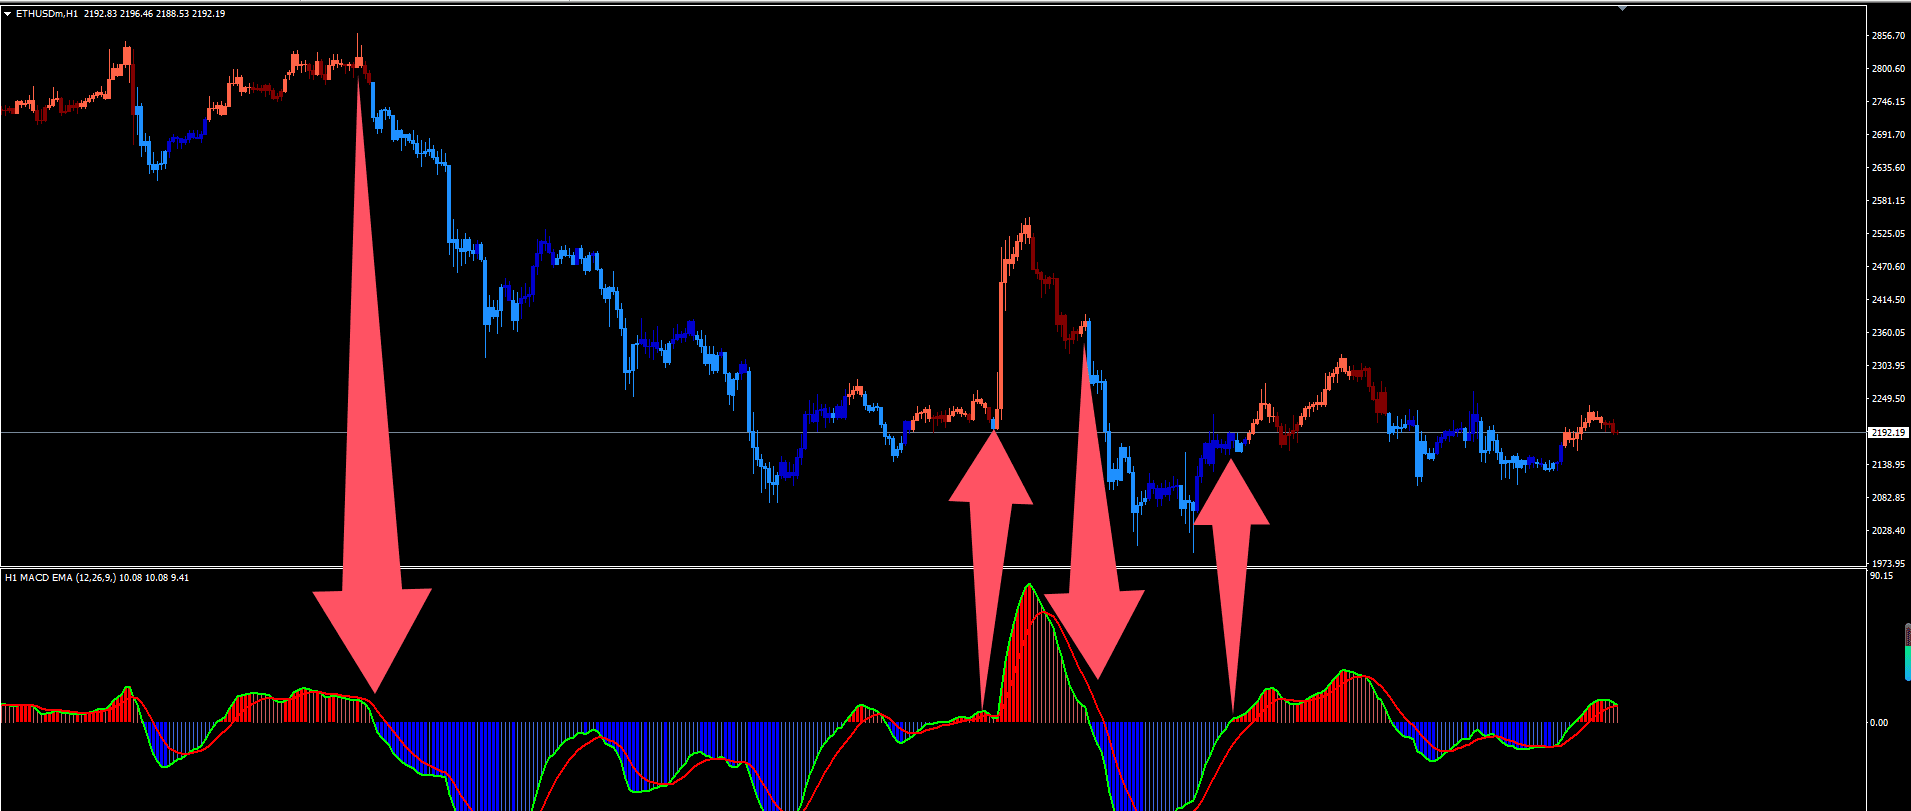
V. Practical Cases
Taking the fast and slow line cross strategy as an example:
Buy Signal:
DIF crosses above DEA (Golden Cross) and is above the zero axis;
RSI not overbought (e.g., below 70).
Sell Signal:
DIF crosses below DEA (Death Cross) and is below the zero axis;
RSI not oversold (e.g., above 30).
Stop Loss: Price falls back to recent lows (buy) or rises to recent highs (sell).
Take Profit: Price hits the opposite signal or a fixed risk-reward ratio (e.g., 2:1).
Conclusion
The MACD trading system is a classic and versatile trend-following tool, but its performance depends on market conditions and parameter settings. Through reasonable optimization, strict risk control, and psychological discipline, this system can become a cornerstone of stable profitability. However, traders must be aware: no system can adapt to all market conditions; the key lies in long-term consistent execution and continuous improvement.