shows a recovery after falling from $130 to $92.93. The price is now at $105.32 (+3.07%).
What can be noticed from technical analysis?
📉 Strong decline in the past: LTC suffered a strong decline in January-February, but is now showing signs of recovery.
📊 Support and resistance levels:
Support: $100 (if it breaks down, it may go to $92)
Resistance: $109-110 (if it breaks upwards, we can expect growth to $117)
📈 Indicators:
Bollinger Bands: The price is approaching the middle line (104.52), but has not yet reached the upper limit (108.16). This indicates the possibility of further growth.
MACD: The lines crossed in the positive zone – this is a signal for possible growth.
RSI (53.66): Neutral zone, there is still room for growth.
OBV (volume): Stable, no strong liquidity outflow.
What to do?
✅ Buy if LTC breaks through $109 and consolidates above – this will be a signal for further growth.
❌ Sell if the price drops below $100 – you may see a further decline.
Conclusion: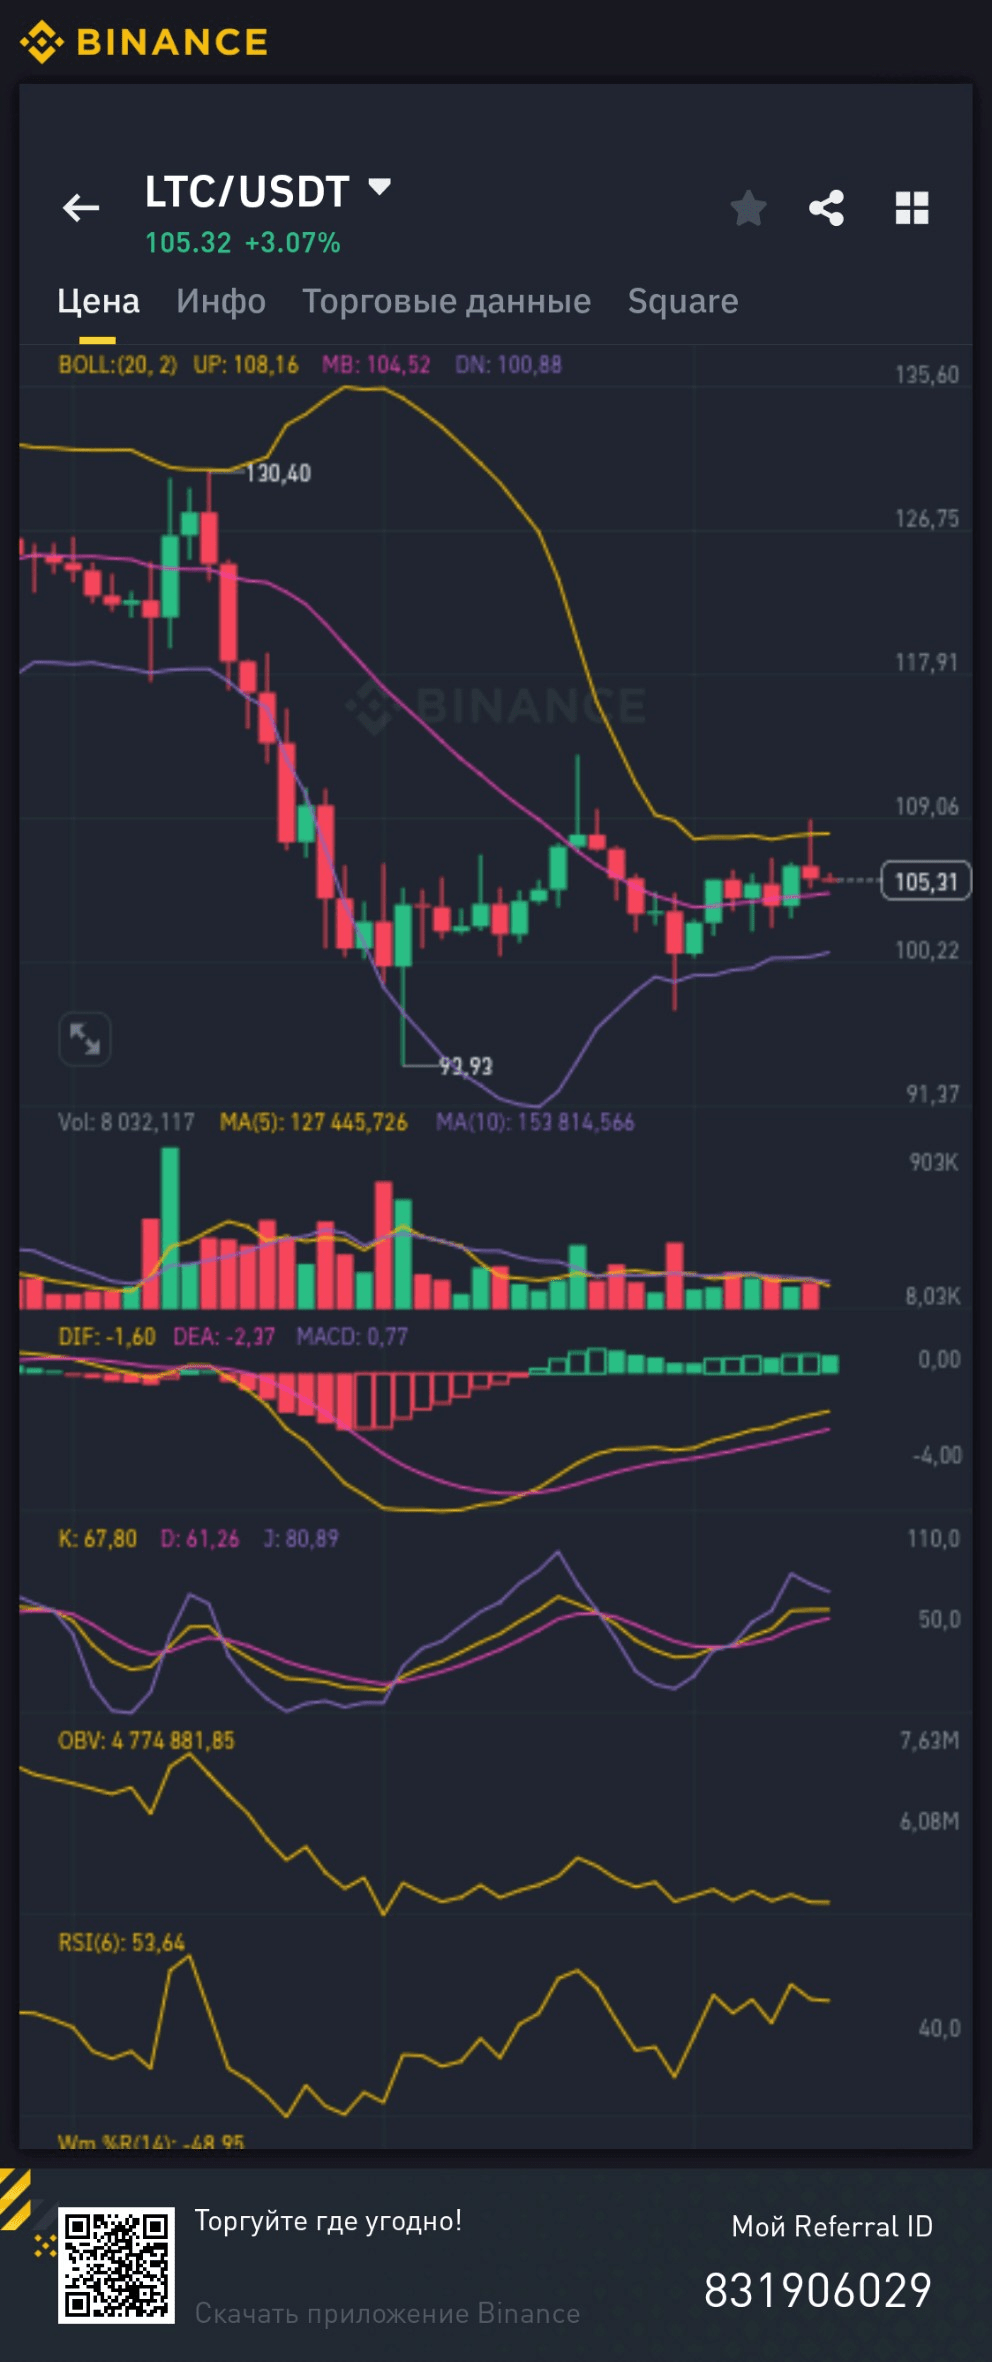
Litecoin is currently in the uncertainty zone, but with positive market movements it may show growth. If you want to enter a position, it is better to wait for confirmation of a breakout of $109 or a decline to $100 to buy on correction.
🚀 #LitecoinUpdate #CryptoTrading #LTC #BİNANCE #TradeSmart $LTC