#TexasBTCReserveBill #Trump’sExecutiveOrder #MarketPullback #MexicoEndsTariff #WhiteHouseCryptoSummit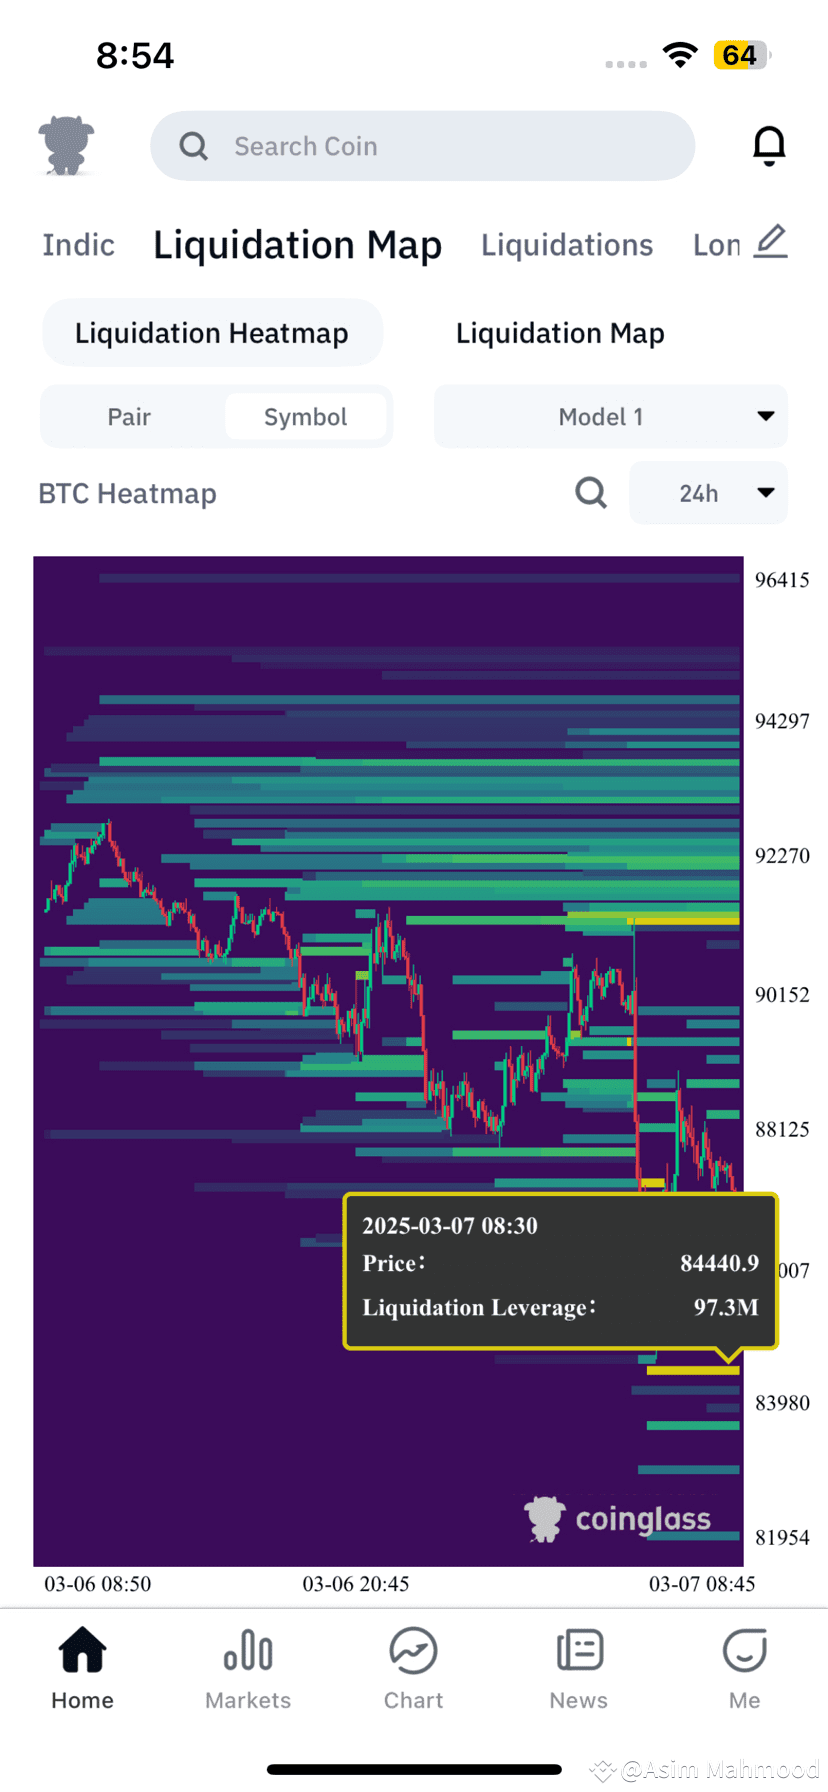 $BTC
$BTC
Bitcoin’s price action has once again triggered a significant wave of liquidations, with $97.3M in leveraged positions getting wiped out at $84,440.9, as shown in the liquidation heatmap from Coinglass. This level marks a critical liquidity zone where market makers may be targeting overleveraged traders.
📊 Why $84,440 Is a Key Liquidity Level?
Liquidation heatmaps reveal where traders have placed high-leverage positions, making these areas prime targets for price movements engineered by market makers and whales. The clustering of liquidations around $84,440 suggests:
✅ A high concentration of long liquidations, meaning traders who were betting on BTC’s price increasing got stopped out.
✅ Market makers potentially pushing price lower to trigger more liquidations before a reversal.
✅ A possible liquidity grab, where large players collect orders before a major move.
🔍 The Market Maker Strategy: Stop Hunts & Liquidation Events
Market makers and institutional players often target areas where liquidations are stacked, as it allows them to:
📌 Absorb liquidity before reversing the trend.
📌 Shake out retail traders before pushing price in the desired direction.
📌 Trigger cascading liquidations, causing rapid price moves.
If BTC continues its decline below $84,440, we could see further liquidations at lower levels, potentially around $82,000-$83,500—another high-liquidity zone.
⚡ Key Takeaways
🔸 $84,440 has acted as a major liquidation level, with $97.3M in liquidations.
🔸 Market makers might be hunting liquidity, causing stop hunts and fakeouts.
🔸 If BTC breaks further down, watch $82,000-$83,500 as the next major liquidity pool.
🔸 A potential reversal could occur once liquidity is collected, leading to a strong price rebound.
Traders should remain cautious, especially when using leverage, as liquidity hunts are common in highly volatile markets like Bitcoin. 🚀