Author: Aiberg Roschild
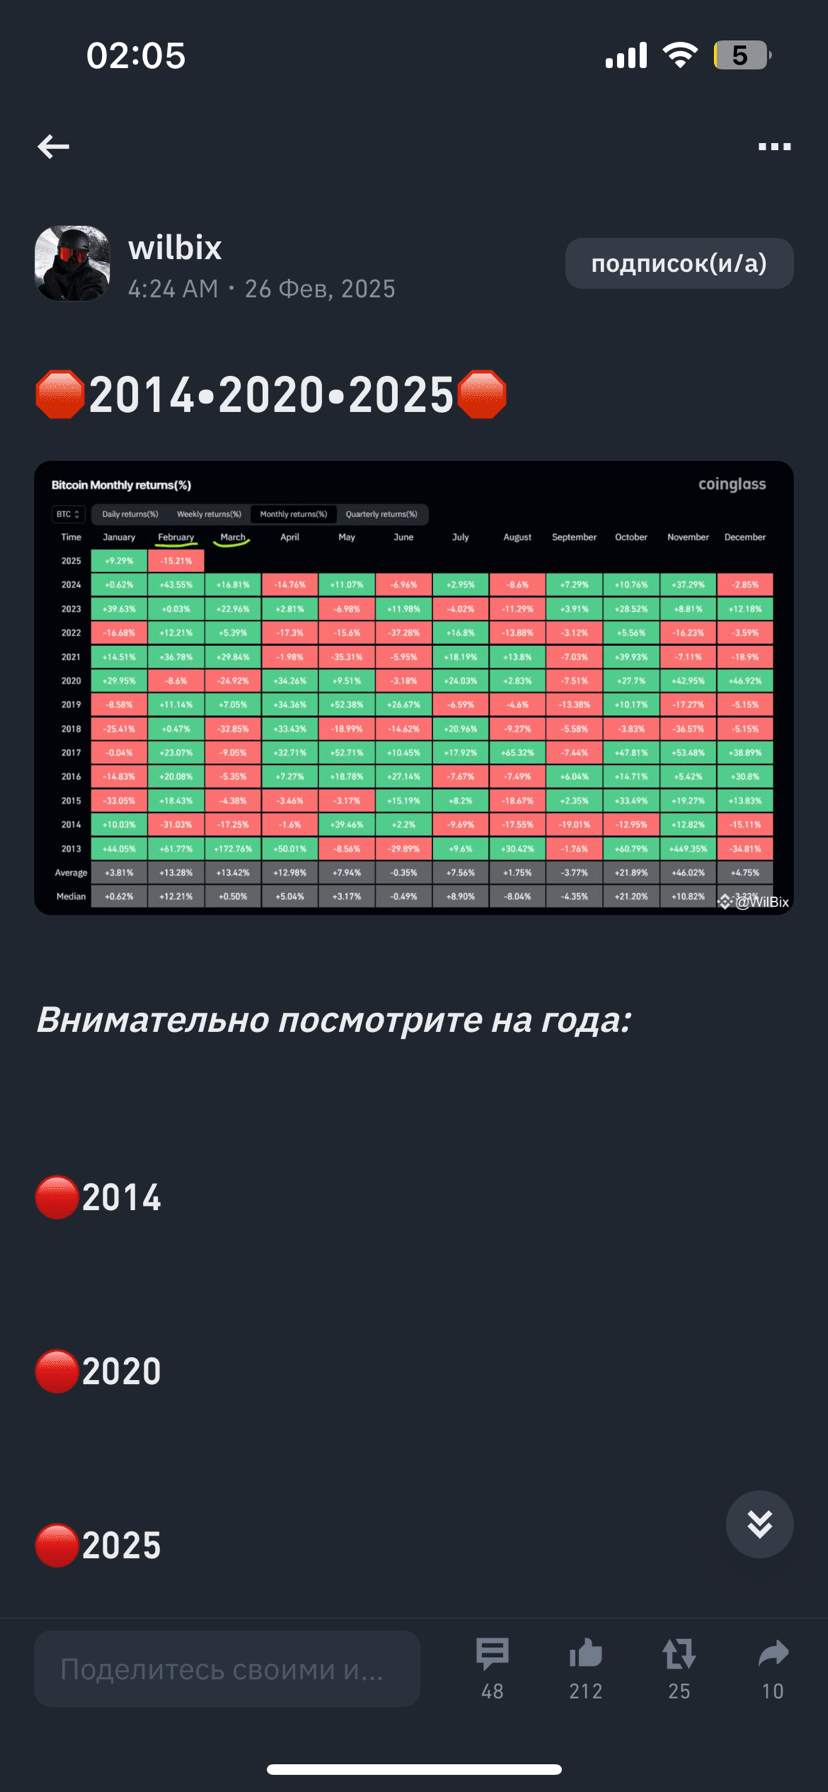
A look at historical cycles: 2014, 2020, and 2025
Context and historical retrospective
2014
After the phenomenal boom of 2013, Bitcoin faced a sharp collapse in 2014.
• February 2014 demonstrated a substantial drop of -31.03%, signaling the beginning of a prolonged bearish phase.
• March 2014 continued the negative trend with a decline of -17.25%.
This year is remembered by investors as a period of sharp market cooling after a turbulent rise.
2020
The year 2020 turned out to be unusual: against the backdrop of expectations for another halving and the global crisis related to the COVID-19 pandemic, the market experienced significant volatility.
• January 2020 opened with a bright increase of +29.95%, reflecting investor optimism ahead of significant events.
• February 2020 showed a correction of -8.60%, and March 2020 saw a sharp decline of -24.92%, coinciding with the global market crash due to the pandemic.
Despite this strong correction period, the subsequent rebound made 2020 one of the most memorable years for Bitcoin.
2025
Data analysis for 2025 (which may be predictive or represent current dynamics) allows us to see similarities with previous cycles:
• January 2025 started with a positive result (+9.29%), although less impressive compared to January 2020.
• February 2025 has already turned out negative (-15.21%).
If the trend continues and March turns out negative, it may indicate the beginning of a correction period similar to early 2014 or 2020.
What can be gleaned from the observed patterns?
1. Seasonality and cyclical volatility
• Historical data shows that February often becomes a month of correction: significant drops were observed in 2014, 2020, and possibly in 2025.
• This may be related to both seasonal factors and market expectations, as investors take profits after strong starts in January.
2. Strong start in January and subsequent correction
• In both cases (2014 and 2020), January began with significant growth. However, the subsequent dynamics – sharp declines in February and March – indicate possible "overheating" of the market at the beginning of the year, followed by a correction.
3. Lessons for investors
• Historical cycles show that rapid growth at the beginning of the year does not guarantee stable growth throughout the year.
• Investors should be prepared for volatility in the early months of the year and consider correction periods as a natural part of the market cycle.
• Analyzing previous cycles helps to form a more balanced strategy, especially if forecasts for 2025 confirm similar patterns.
4. Characteristics of the current cycle (2025)
• If negative dynamics persist in February 2025 and then in March, it may signify the beginning of another correction cycle similar to 2014 or March 2020.
• However, it should be remembered that past performance does not guarantee future results, and contemporary factors such as institutional adoption, regulatory environment, and technological innovations can change market dynamics.
Conclusion
Observing key years – 2014, 2020, and 2025 – allows us to see recurring market patterns: strong growth at the beginning of the year, followed by significant correction in February (and often in March). These cyclical features provide important signals for investors, emphasizing the need for caution during periods of sharp volatility. Despite similarities in patterns, each cycle has its unique characteristics influenced by global economic conditions, internal market dynamics of cryptocurrencies, and new technological trends.
This analysis can serve as a foundation for making more balanced investment decisions and can also be an important guide for traders and long-term investors.
Don't forget to subscribe to avoid missing fresh analytical materials and updates!
Aiberg Roschild | 7Crypt
#BTCDipOrRebound #BTC走势分析 $BTC