🎯 First, the key points: $SOL Operating strategy: follow the trend and maintain strict risk control!
📌 Long strategy (light position trial long)
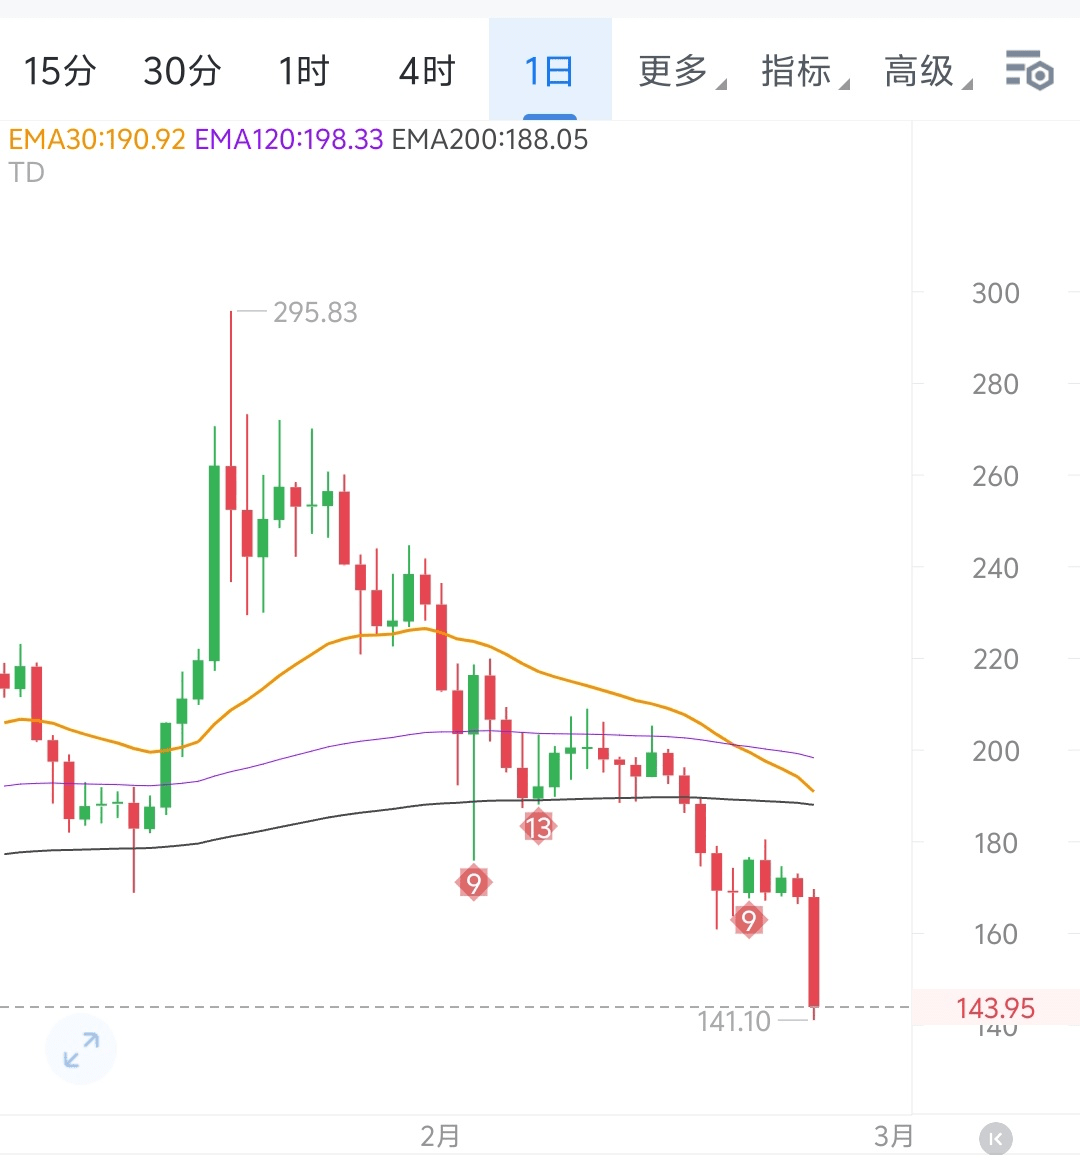
First target: 140 USDT (previous low 141.1 + round support, light position trial long)
Second target: 135 USDT (stronger support level, higher risk-reward ratio)
🛑 Stop loss discipline: decisively exit if it falls below 132 USDT!
—
📌 Short strategy (layout at rebound resistance levels)
First target: 150 USDT (round number + short-term selling pressure zone)
Second target: 155 USDT (EMA7 suppression + rebound high point)
🛑 Stop loss discipline: Give up and exit if it breaks 158 USDT!
Analysis—
Recent prices show a clear downward trend, with a strong selling pressure released on February 24 through a large bearish candle, breaking the key support at 150 USDT. Combining K-line patterns, technical indicators, and trading volume, we will analyze key signals in 3 minutes and develop response strategies below.
---
🔍 Trend analysis: Bearish control, weak rebound
1️⃣ K-line pattern: Accelerating decline
Large bearish candle warning: The long bearish candle on February 24 broke through 150 USDT, with bearish forces taking absolute control.
Resistance level suppression: The previous high point of 200 USDT forms strong resistance, and the current price is far from the resistance zone, making a short-term reversal difficult.
2️⃣ Technical indicators: Overall bearish
MACD signal: DIF and DEA continue to decline, with the histogram's negative value expanding, indicating strong bearish momentum.
RSI close to oversold: Value 26.07, close to the oversold zone but no divergence observed, need to be cautious of further declines.
EMA death cross confirmed: EMA7 crosses below EMA30/120, moving averages are in a bearish arrangement, and the trend is clearly bearish.
3️⃣ Volume secret: Selling pressure concentrated and released
Volume breakout: On February 24, trading volume surged to over 7 million, accompanied by a price crash, with panic selling concentrated.
Volume contraction and decline: Previously stable trading volume, if it continues to shrink after a surge, it may enter a declining mode.
⚠️ Risk warning
Oversold trap: Although RSI is close to oversold, there are no divergence signals, and the risks of bottom-fishing are extremely high!
Moving average suppression: EMA bearish arrangement remains unchanged, and the rebound is merely a technical correction; don't be greedy!
Liquidity risk: After the trading volume shrinks, prices can be easily manipulated by large orders, increasing volatility.
---
Summary from the European market:
Short-term trend is clearly bearish, light position trial long near 140, take profits in batches above 150! Remember, in a weak market, stop losses are more important than profits; discipline must be executed upon breaking levels!
(The strategy only represents personal opinions and is for reference only. The market has risks, and over-leveraging can lead to liquidation!)
Lastly, don't forget to follow and give a thumbs up! Wishing you abundant wealth in 2025!