GM☀️ I am Oupeng. Today is February 16th. In today's trend analysis, let's break down the key points of BTC together and find short-term opportunities.
BTC has been oscillating at high levels recently, with small price fluctuations. From the daily K-line perspective, small real body K-lines with upper and lower shadows have appeared multiple times, indicating a divergence between bulls and bears, and the short-term direction remains unclear. Next, let's look at the specific signals given by the market and provide short-term buying and selling points.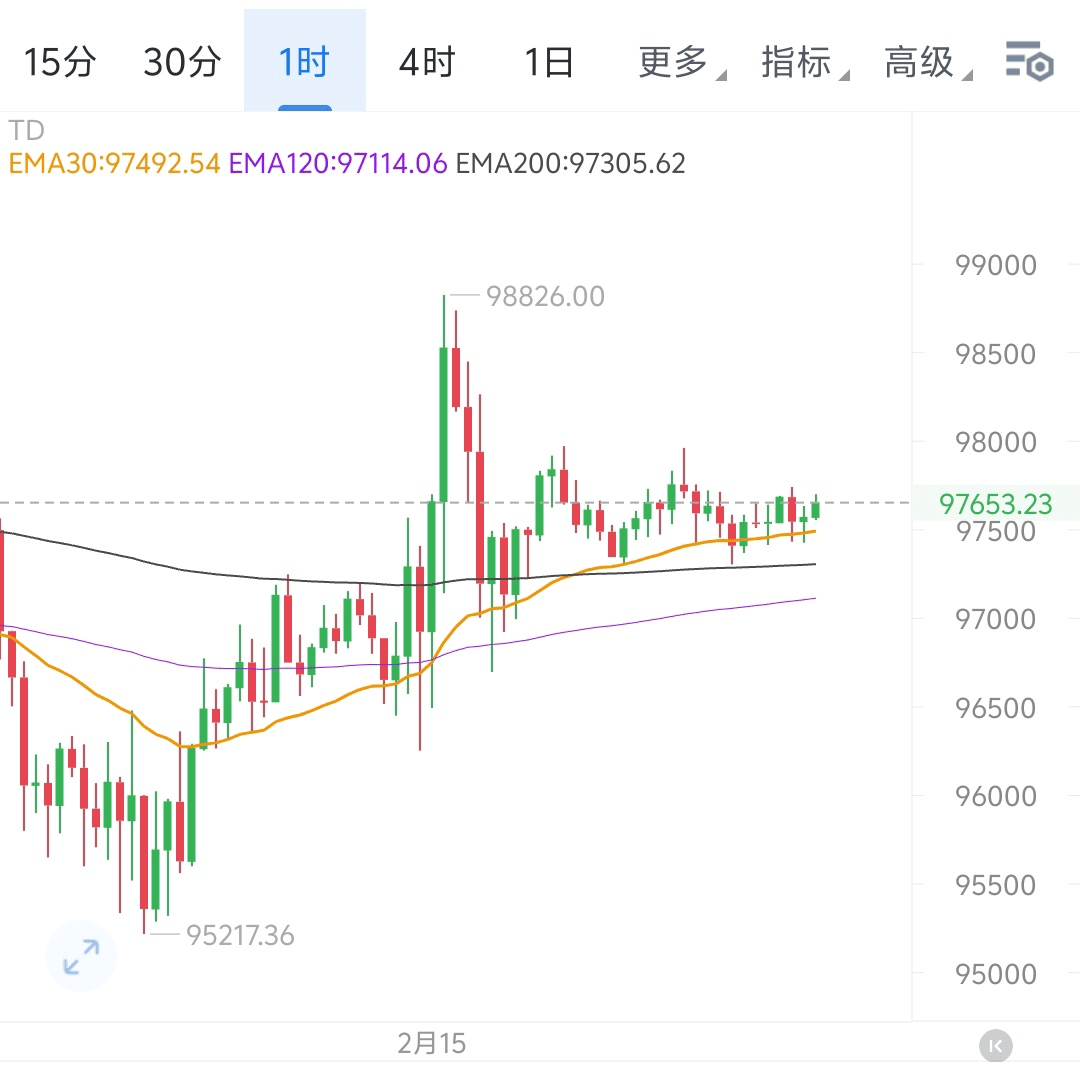
Price Trend Analysis
1. K-line Pattern
Recent BTC prices have been oscillating at high levels, with small fluctuations, indicating that the market is in a wait-and-see state.
On the daily chart, small real body K-lines with long shadows have appeared multiple times, indicating a strong market uncertainty, with both bulls and bears in contention.
2. Technical Indicators
MACD
The hourly MACD is below the zero axis, but DIF and DEA are gradually approaching, which may form a golden cross, indicating signs of a short-term rebound.
If MACD forms a golden cross, BTC may welcome short-term rebound opportunities.
RSI
The RSI value is currently oscillating around 50, not entering the overbought or oversold zone, indicating a temporary lack of clear trend in the market.
The RSI trend is neutral and needs to be observed whether it breaks above 60 to enter the strong zone or drops below 40 to enter the weak zone.
EMA
Short-term prices are close to EMA7, indicating that there is still support in the short term.
EMA30 and EMA120 are still in a bullish arrangement, and the long-term trend remains upward.
3. Volume Changes
The overall trading volume at the hourly level is relatively low, indicating insufficient market activity and a strong wait-and-see sentiment.
Daily trading volume has decreased, showing a decline in market participation compared to previous days, indicating a lack of strong willingness for short-term capital inflow.
Buying and Selling Point Reference
Long Strategy
Buy Point One:96500 (close to the previous low, the round number may form support)
Buy Point Two:95500 (further probing into a stronger support area, also near EMA120)
Long Stop Loss Point: 95000 (break below important support level to prevent deep pullback risk)
Short Selling Strategy
Sell Point One:98500 (close to recent highs, the round number may form resistance)
Sell Point Two:99500 (after breaking through, upward space opens up, close to the psychological level of 100000)
Short Stop Loss Point:100500 (break through key resistance level to avoid losses from trend reversal)
Oupeng Summary
BTC is currently still in a consolidation phase, with intense battles between bulls and bears, and the market direction remains unclear. From a technical perspective, short-term attention should be paid to whether the support near 96500 is effective; if it breaks, BTC may further pull back to 95500. If the market rebounds, attention should be given to the pressure near 98500 and 99500.
It is recommended to strictly set stop losses for short-term operations and patiently wait for the market to provide clearer direction.