GN🌙 I am Oupeng. Today, let's take a look at the technical performance of SOL. SOL is in a downward trend. From the K-line data, in the past hour, the SOL price has significantly dropped and has already broken below the important threshold of 200. It is expected to continue declining in the future.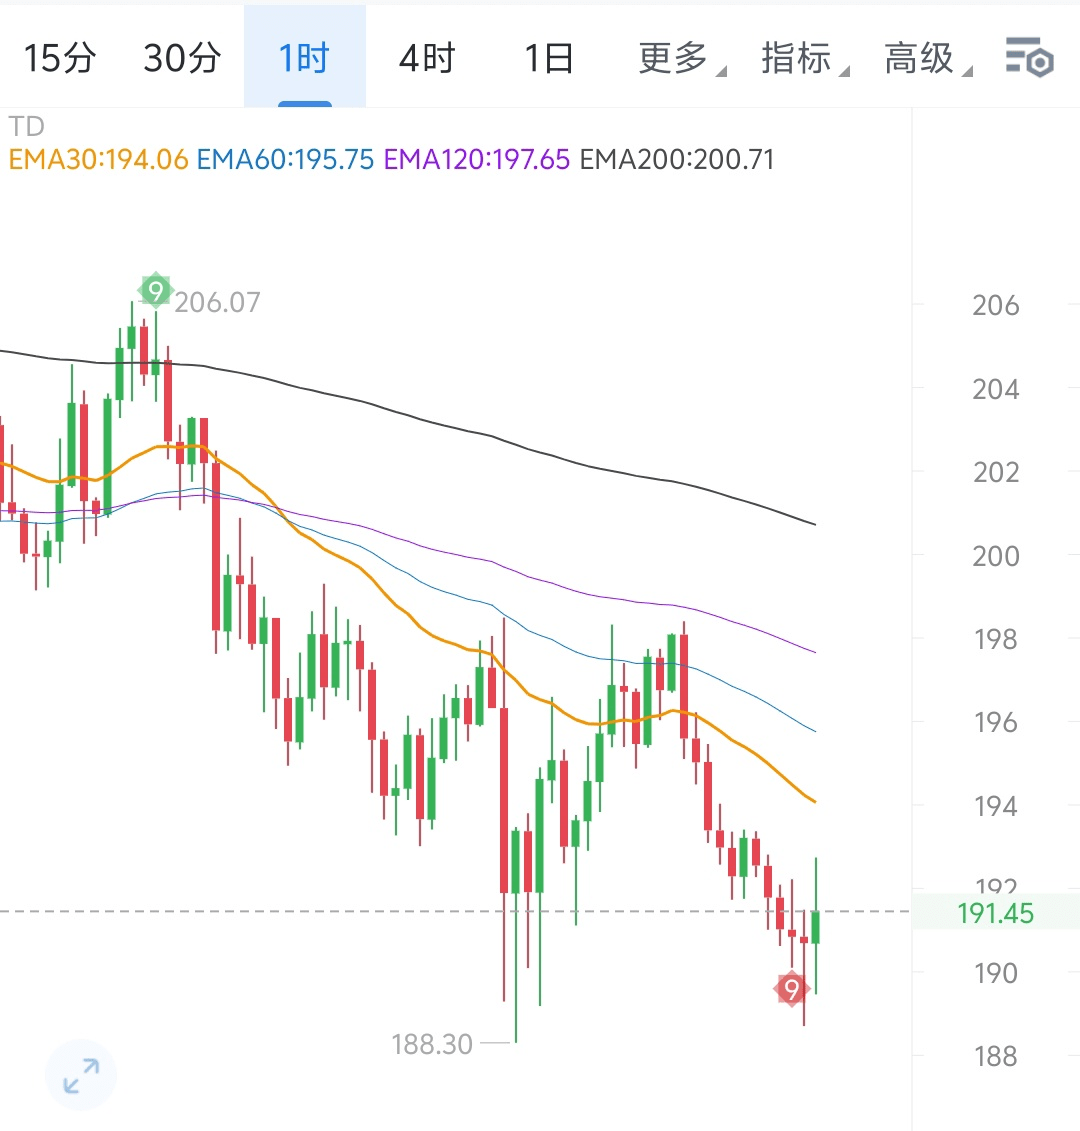
---
Recent Price Fluctuations and Volume Analysis
Price Analysis: From the K-line trend, SOL is in a downward trend. In the past period, the price has experienced significant declines multiple times, with each drop being substantial, indicating strong selling pressure in the market. Therefore, it is expected that the price will continue to face pressure in the short term, with significant downward pressure.
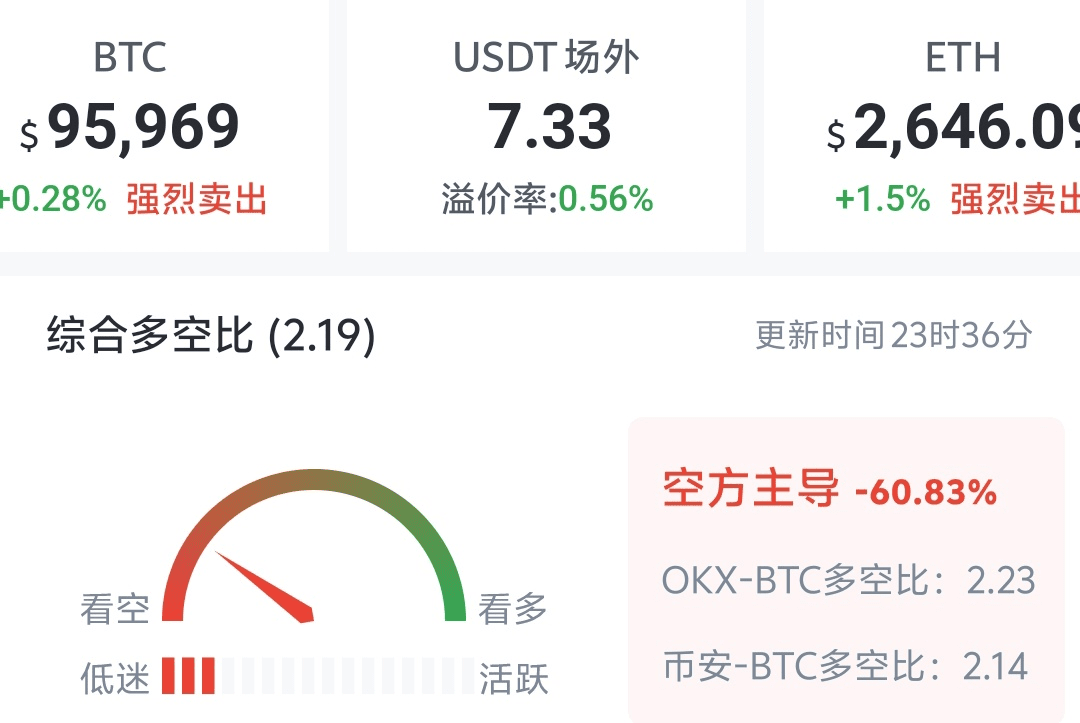
Volume Changes: In the 1-hour cycle, trading volume is fluctuating. When the price declines, trading volume increases, showing the selling force in the market. Although trading volume expands during price declines, the overall volume is still relatively low, indicating low market participation, which may limit the rebound potential of SOL/USDT.
Market Heat: The market heat ranking of SOL has dropped to 3rd place. Although it is still good, the market's attention towards it has decreased compared to previous heat levels. This may further suppress price increases, leading to weaker market conditions in the short term.
---
Technical Aspects
MACD: The current MACD line is operating below the zero line, indicating strong bearish force. DIF and DEA have been negative for several hours, showing that bearish pressure has not weakened. However, MACD is converging at a low level, and attention should be paid to whether a golden cross signal will occur subsequently. If a golden cross forms, there may be a short-term rebound.
RSI: The current RSI value is around 40, which is relatively low and may be consistent with the price correction or flat state. Although it has not entered the oversold zone, further observation is needed to see if it will enter the oversold area to make a clearer operational judgment.
EMA: In the short term, EMA7 is just below the current price of 191.74 USDT, showing some support. However, both EMA30 and EMA120 are in bearish alignment, and the moving averages are trending downward, indicating that the long-term trend remains weak, and the price may continue to face pressure.
---
Reference for Buy and Sell Points
Buy Point One: 185 USDT (price near previous low point, offers some support)
Sell Point One: 198 USDT (close to previous high point, may encounter pressure)
Buy and Sell Suggestions:
If the price rebounds to around 198 USDT and shows some rebound momentum, consider going long.
If the price breaks below 190 USDT, further declines may occur. Consider looking for short opportunities near 185 USDT.
---
Oupeng Reminder
Current market participation is low, and the short-term rebound potential of SOL/USDT may be limited. If the price continues to decline, pay attention to the support level at 185 USDT. If this support breaks, further declines may occur. It is recommended to operate cautiously to avoid chasing highs and cutting losses.
---
Oupeng Summary
From a technical perspective, SOL/USDT is under downward pressure, with strong selling force in the market, and the price is oscillating around 190 USDT. Be cautious of further declines in the short term. We suggest paying attention to the support level at 185 USDT and the rebound opportunity near 198 USDT, waiting for a clear breakout signal from the market.#欧鹏趋势分析