$SOL 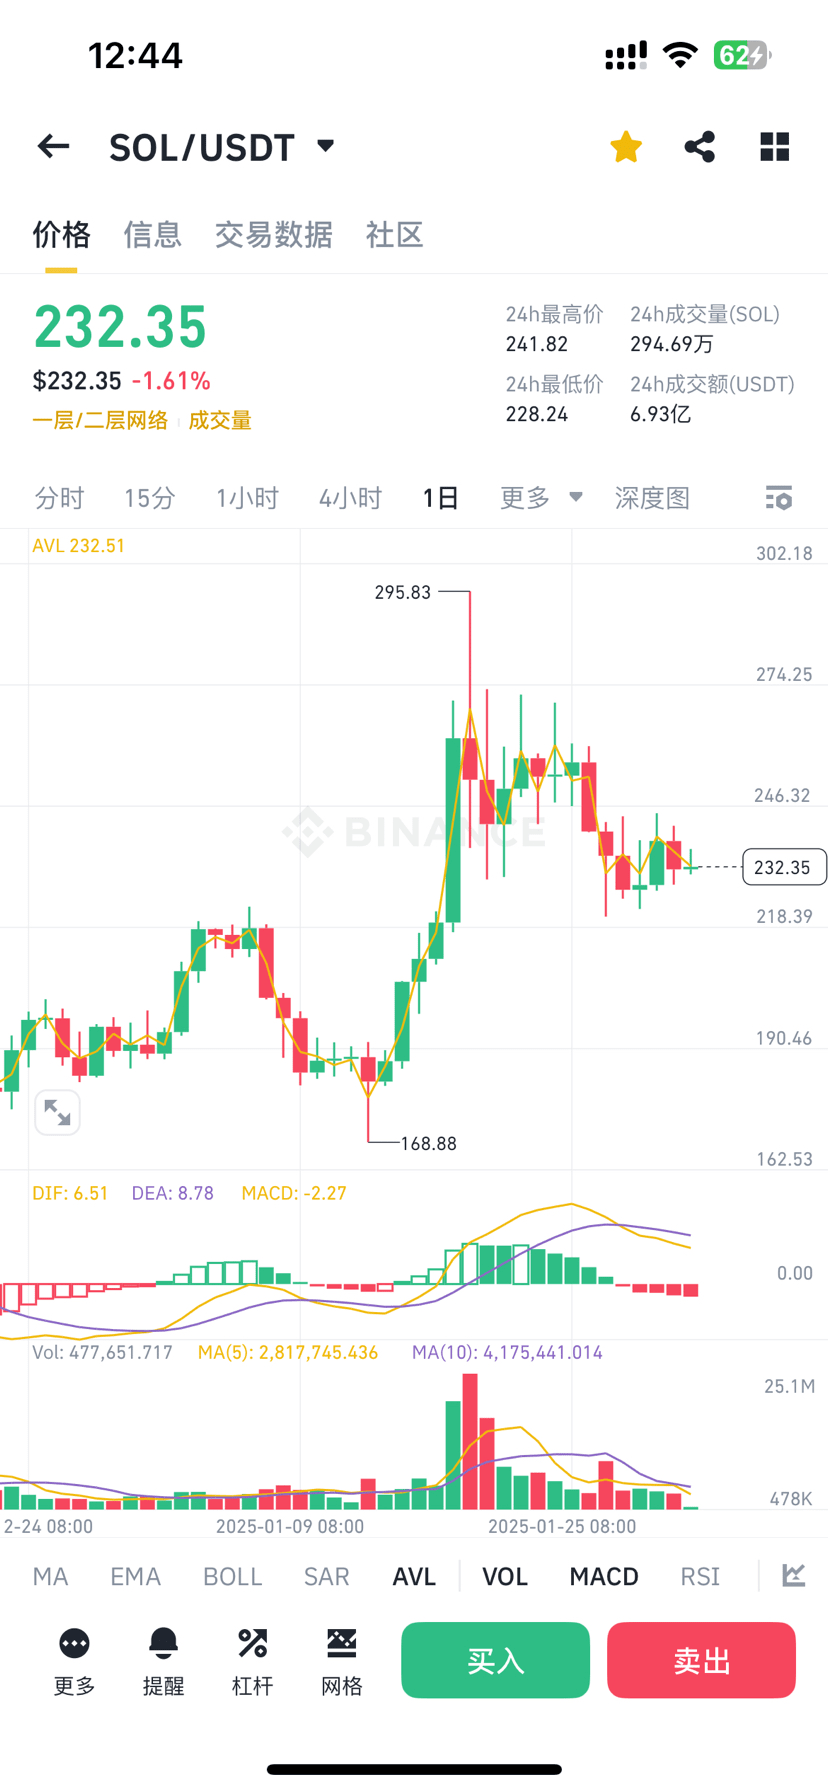 Based on current technical indicators and market data, without considering black swan events and political factors, the price trend of SOL/USDT can be analyzed as follows:
Key Indicator Interpretation
1. Short-term Trend (MACD)
- MACD bars are negative (-2.27), DIF (6.51) is below DEA (8.78), indicating short-term seller momentum is dominant, with further pullback pressure existing.
- If the DIF crosses above the DEA forming a 'golden cross', it may trigger a rebound signal; conversely, if it continues to decline, it may test lower support.
2. Price Range and Trading Volume
- Current price $232.35, 24-hour fluctuation range is $228.24 (low) — $241.82 (high).
- 24-hour trading volume 2.9469 million SOL, trading amount 693 million USDT, market activity is high, but caution is needed for the risk of a sharp decline.
3. Support and Resistance
Key Support Levels: $228 (recent low), $218 (previous low testing level).
Key Resistance Levels: $241 (24-hour high), $246 (recent rebound high), $274 (mid-cycle pressure level).
Price Prediction Range
1. Conservative Scenario (Weak Consolidation)
- If the MACD continues to decline and breaks below the $228 support, it may test the $200–$215 range.
- Trigger Factors: Shrinking trading volume, low market sentiment.
2. Neutral Scenario (Range Fluctuation)
- Likely to fluctuate in the $220–$245 range, waiting for technical recovery (such as MACD golden cross or RSI oversold rebound).
- Short-term trading opportunities: Support/resistance levels for swing trading.
3. Optimistic Scenario (Trend Reversal)
- If it breaks above $245 and stabilizes, it may challenge $260–$275 (referencing previous highs and pressure from trapped positions).
- Trigger Factors: Major funds entering, market sentiment improving.
Operation Suggestions
1. Short-term Traders:
- If it breaks below $228, consider stop-loss and wait; if it rebounds to the $240–$245 area and faces resistance, take partial profit.
- Pay attention to whether the RSI enters the oversold area (<30), combined with MACD golden cross as a bottom-fishing signal.
2. Medium to Long-term Holders:
- If the price falls back to $200–$215, consider building positions in batches, targeting $275 (technical recovery + market cycle rotation).
- Continuous monitoring of on-chain data is needed (such as position distribution, exchange inflow).
Risk Warning
High Volatility: The cryptocurrency market is easily driven by emotions, and even excluding external factors, it can still experience extreme fluctuations due to large sell-offs or contract liquidations.
Technical Limitations: Indicators like MACD/MA are lagging, and more data (such as on-chain active addresses, futures positions) should be combined for a comprehensive judgment.
Conclusion: In the next 1-3 months, the SOL/USDT price is more likely to fluctuate in the $200–$275 range, with the breakthrough direction depending on market sentiment and major fund movements. In the short term, be cautiously bearish; in the medium to long term, if key support holds, there is still room for a rebound.$SOL