#stablecoin#USDT#USDC #BUSD
Data meaning:
1. Histogram value <0: represents that the MACD line is less than the signal line, indicating a long-term bearish trend
2. Histogram value > 0: It means that the MACD line is greater than the signal line, which is a long-term positive trend.
3. Dark color of histogram: represents month-on-month acceleration, red represents short-term bearish trend
4. Light color of histogram: represents month-on-month deceleration, pink represents short-term positive trend
Last week's data:
Figure 1: USDT supply histogram, long-term bearish + short-term bullish trend
Figure 2 below: BUSD supply histogram, long-term bearish + short-term neutral trend
Figure 3 below: The total supply histogram of USDT+BUSD can represent the momentum of the main trading funds in the market. The sum of the two can also avoid the influence of the rise and fall of a single stablecoin on the judgment of the trend. This chart is currently in a long-term negative + short-term positive trend


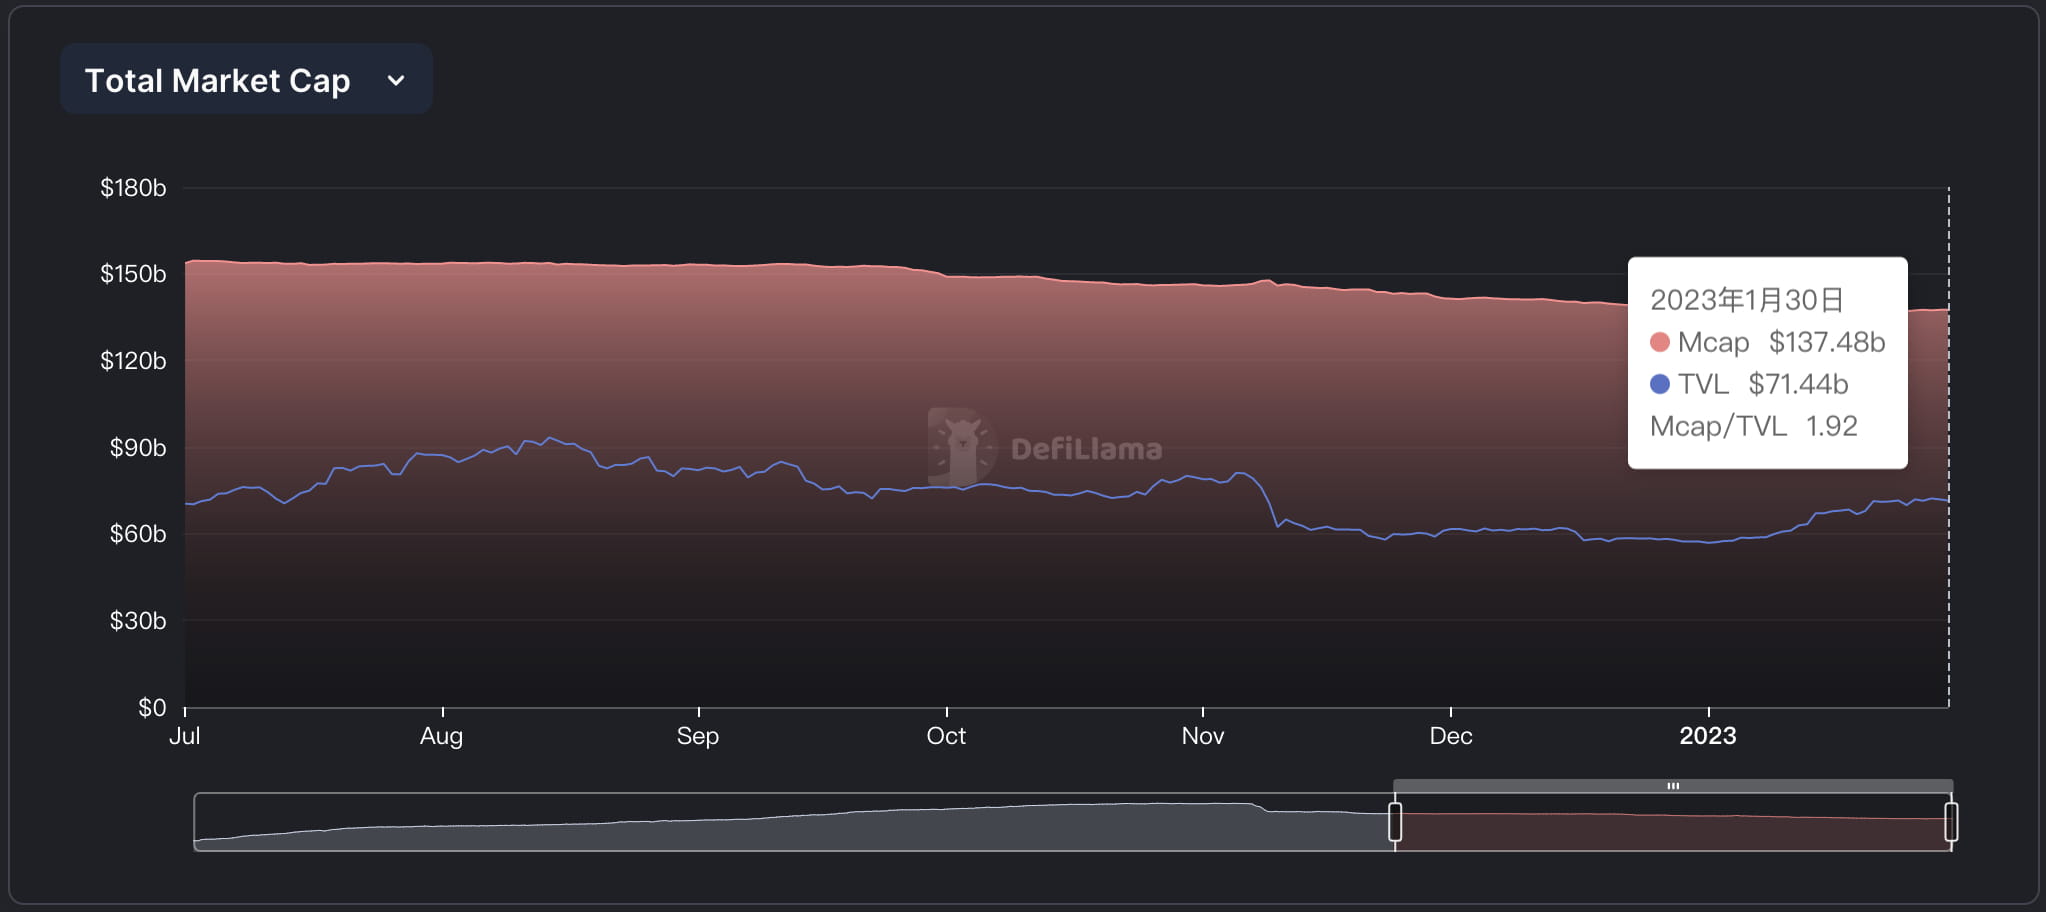
Mcap/TVL
Mcap/TVL is the ratio of the total market value of stablecoins to TVL, which reflects the utilization rate of funds of stablecoins on the chain.
The higher the utilization rate, the smaller the Mcap/TVL ratio, which means that the market sentiment tends to be optimistic.
The lower the utilization rate, the larger the Mcap/TVL ratio, which means that market sentiment tends to be pessimistic.
Mcap/TVL current value (January 30): 1.92, panic zone, week-on-week increase: -1%
Summarize:
From the supply histogram last week, we can see that the absolute value and momentum of USDT supply have increased significantly, but BUSD is still in the bottom oscillation range.
From the perspective of the total supply of USDT+BUSD, both the absolute value and momentum have increased. However, it has only returned to the level at the end of December last year (83.31 billion). Whether the upward trend can be maintained needs further observation.
From the perspective of on-chain capital utilization, last week's Mcap and TVL increased by about 400 million yuan, indicating that the utilization rate of newly entered funds is high, but the overall utilization rate remains at the same level as the previous week.
If we divide Mcap/TVL into a gear:
1 is neutral: it means that the funds are not leveraged and fully utilized;
1-2 means panic, and greater than 2 means extreme panic;
0.6~1 is greedy, less than 0.6 is extremely greedy;
It can be seen that the current 1.92 has just moved out of the extreme panic range and entered the panic range.