---SOL
SOL/USDT Analysis (4H Chart)
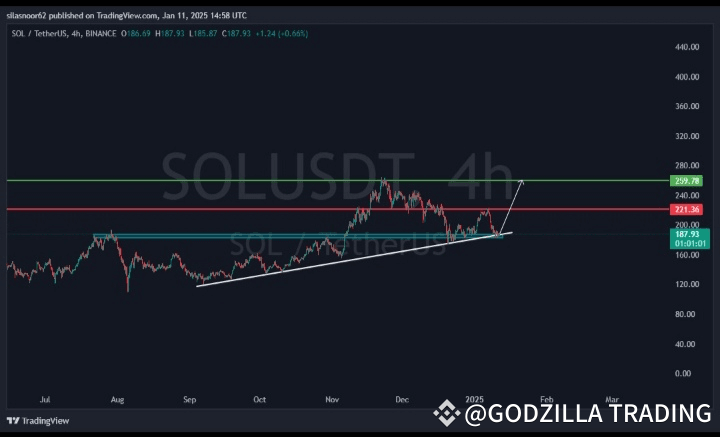
The SOL/USDT pair is showing a clear upward trajectory, respecting a strong ascending trendline since mid-2024. As of now, SOL is trading at $187.93, exhibiting steady bullish momentum. Here’s a detailed breakdown of the current market scenario:
Key Levels to Watch:
1. Support Zone: $160 - $187
The ascending white trendline is acting as a robust support. Any pullback to this zone might present an excellent buying opportunity, as the overall structure remains bullish.
2. Resistance Levels:
$220 (Immediate Resistance): A breakout above this red zone could trigger further upside.
$250 - $280 (Target Zone): This green area is the next major hurdle for SOL, with potential for consolidation or rejection.
Technical Outlook:
Bullish Structure: The price continues to print higher highs and higher lows, a classic sign of bullish momentum.
Volume: A surge in volume near the $220 resistance would strengthen the chances of a breakout.
Projected Move: If SOL successfully breaks $220, it could rally towards $250 and eventually $280, aligning with the upward channel.
Strategy:
For Long Positions: Look for entries near the support trendline ($160-$ETH 187) or on confirmation of a breakout above $220 with increased volume.
Stop Loss: Place it slightly below the trendline to manage risk effectively.
Take Profit Zones: $250 and $280.
Market Sentiment:
The bullish sentiment around Solana remains intact due to its growing adoption and ecosystem development. However, traders should remain cautious of sudden market-wide volatility that could affect SOL's price action.
---