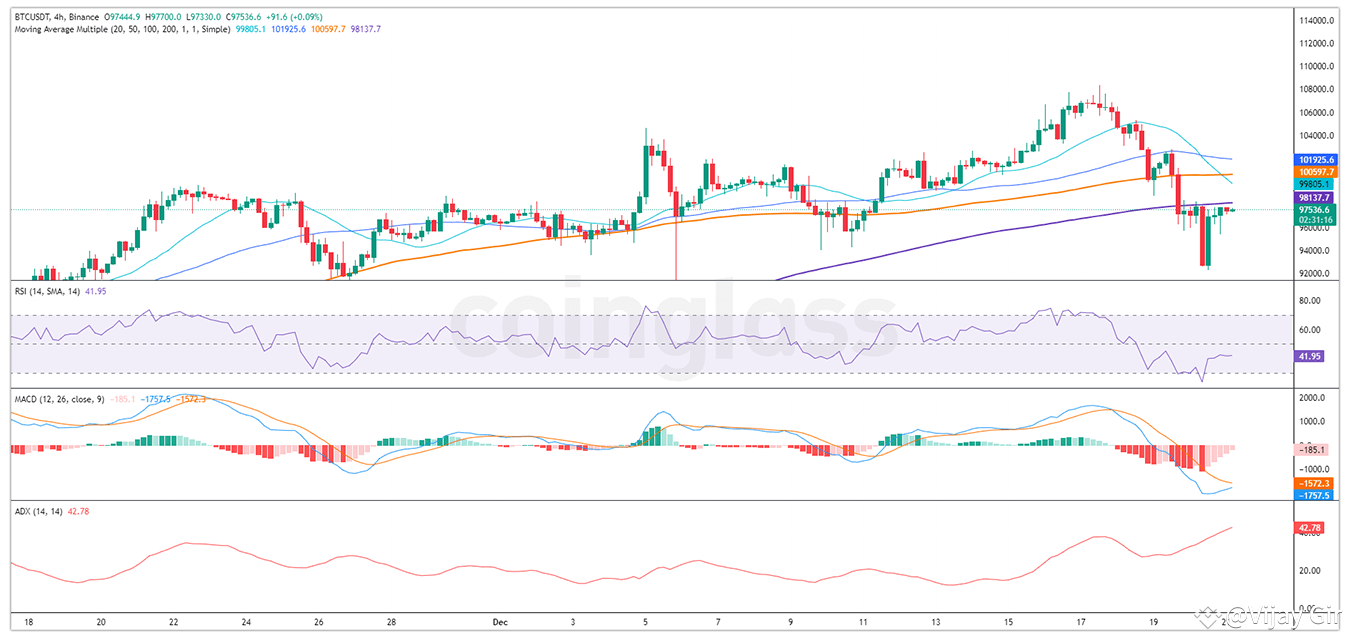
Bitcoin is struggling to recover after dropping to $92,000, as predicted earlier. It has since risen by 5% and is trading at $97,536 but remains in a precarious position. Key market indicators signal ongoing challenges:
Chart Analysis:
Resistance & Support: The 200-day Moving Average (MA) serves as resistance, while the 50-day MA previously supported Bitcoin around $92k. However, this support may falter.
Indicators: The RSI has exited the oversold zone, but the Average Direction Index (33.62) signals weak market trends. The Greed and Fear Index at 73 suggests optimism, but sentiment remains bearish.
Potential Risks: If consolidation continues or the price declines further, the smallest MA (20-day) could cross below the largest, potentially triggering panic selling and sending Bitcoin to $90k or lower.
Liquidation Data:
In the last 24 hours, 296,631 traders were liquidated, wiping $831.74 million from the market, following $1 billion in losses the previous day. High-leverage trades, both long and short, persist, indicating poor risk management. Such trades can trigger sudden market movements aimed at liquidating leveraged positions.

Outlook:
For recovery, Bitcoin must surpass the 200-day MA to reduce negative sentiment and attract investors. A sudden price spike could liquidate reckless short positions, providing temporary support. However, failure to break resistance could lead to a drop below $90k, sparking panic selling and affecting altcoins.

Will Bitcoin rise or face further decline? The next few moves will be crucial for its trajectory.
What do you think?
