Yesterday, Master Wei rested quite late, watching Bitcoin reach new highs, ultimately stopping at 107777. The new high during the day was 106665.8. I was thinking that the market maker's control was somewhat imprecise, not calculating the buying volume properly at 106666. Before I could express this thought, the new high became 107777. Good, good, good, it’s still you, are you a worm in my stomach?
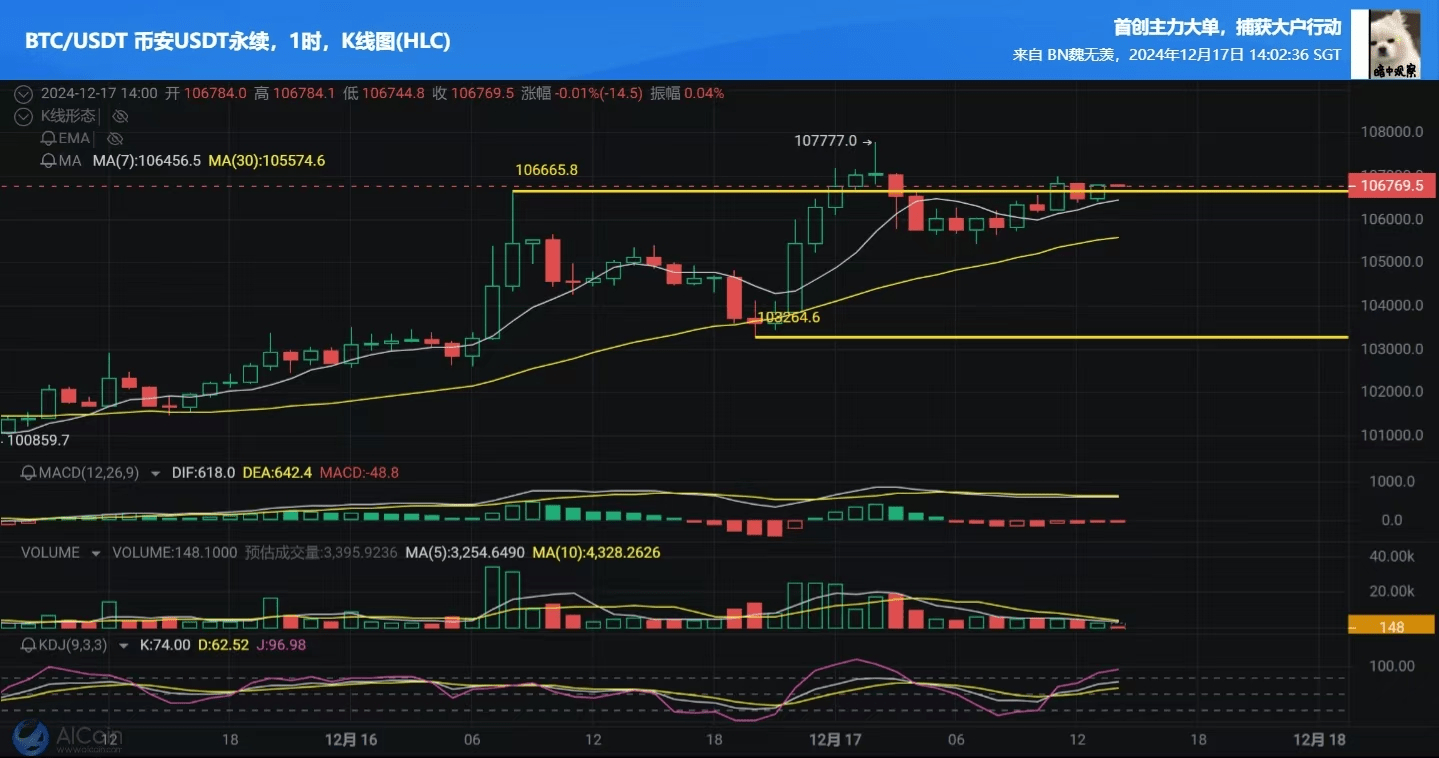
Yesterday afternoon we sent out a trading idea for Bitcoin, aiming to make a profit of 2500 on a short position. Looking at it from today's perspective, it seems a bit hasty. There were indeed over three thousand points from the highest to the lowest point yesterday, but trying to capture eighty percent of that wave is quite difficult. Moreover, in the afternoon, there was no chance to place an order; chasing the long position is even less realistic. I estimate that even if I encouraged you to chase in this market, you wouldn’t dare to enter. Analyzing the 1H, daily K, and weekly K charts, the KDJ indicator clearly shows signs of a downward movement. Last time someone asked how to interpret this indicator, I left some general application rules below for everyone to refer to.
According to the MA30 indicator, the price has rapidly risen above the average ascending line and has shown a brief pullback, trending back towards the average line, which is a clear sell signal.
In terms of operations, short positions can be opened between 106700-107200, with defense set at 107700, just below the new high.
Personally, I feel that this short position is easily breakable. Once it opens for liquidation, it will definitely go to clear the longs without a doubt, but it won't let you do it comfortably, so the medium-term entry is to short at around 107200±500, with defense at 110200, targeting 101500.$BTC