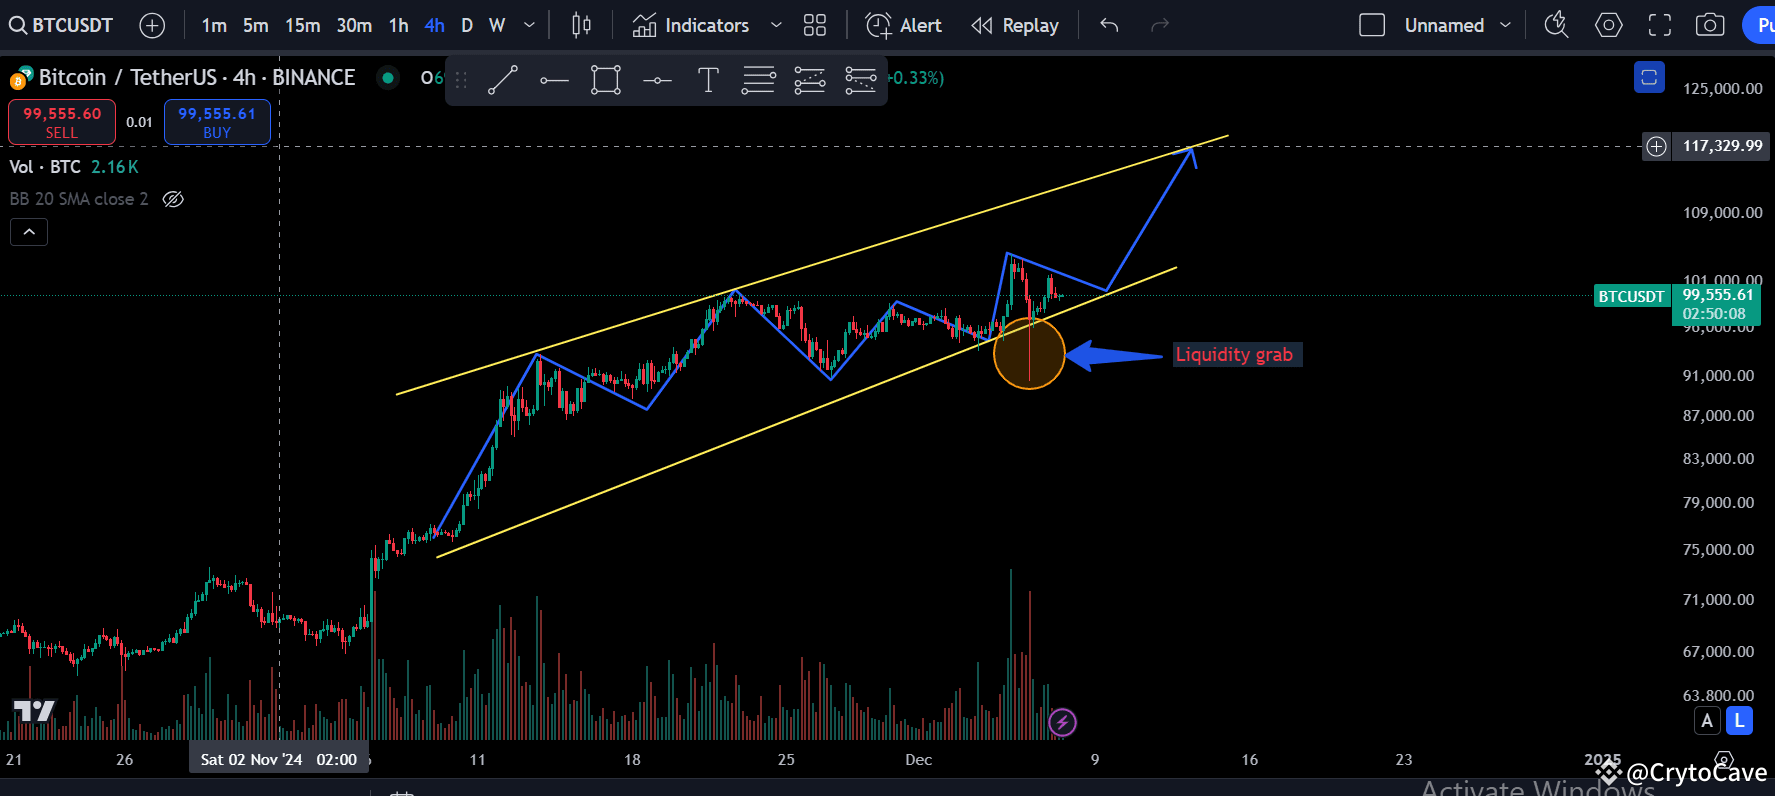
Here i can see that BTC/USDT 4-hour chart displays a rising wedge pattern.its totally uptrend and liquidation grab already done so btc now touch the support and market will boom .volume indicator always make higher high .A breakout above the wedge could confirm a bullish continuation, targeting the $116630.64 level so market will big pump soon .
The USDT dominance chart displays a clear bearish trend, characterized by a double-top formation and a breakdown below key support levels. The RSI confirms the downward momentum, signaling oversold conditions. A further decline in dominance aligns with an anticipated Bitcoin price surge, as capital rotates from stablecoins into BTC and other altcoins. This supports a bullish outlook for Bitcoin's price action.
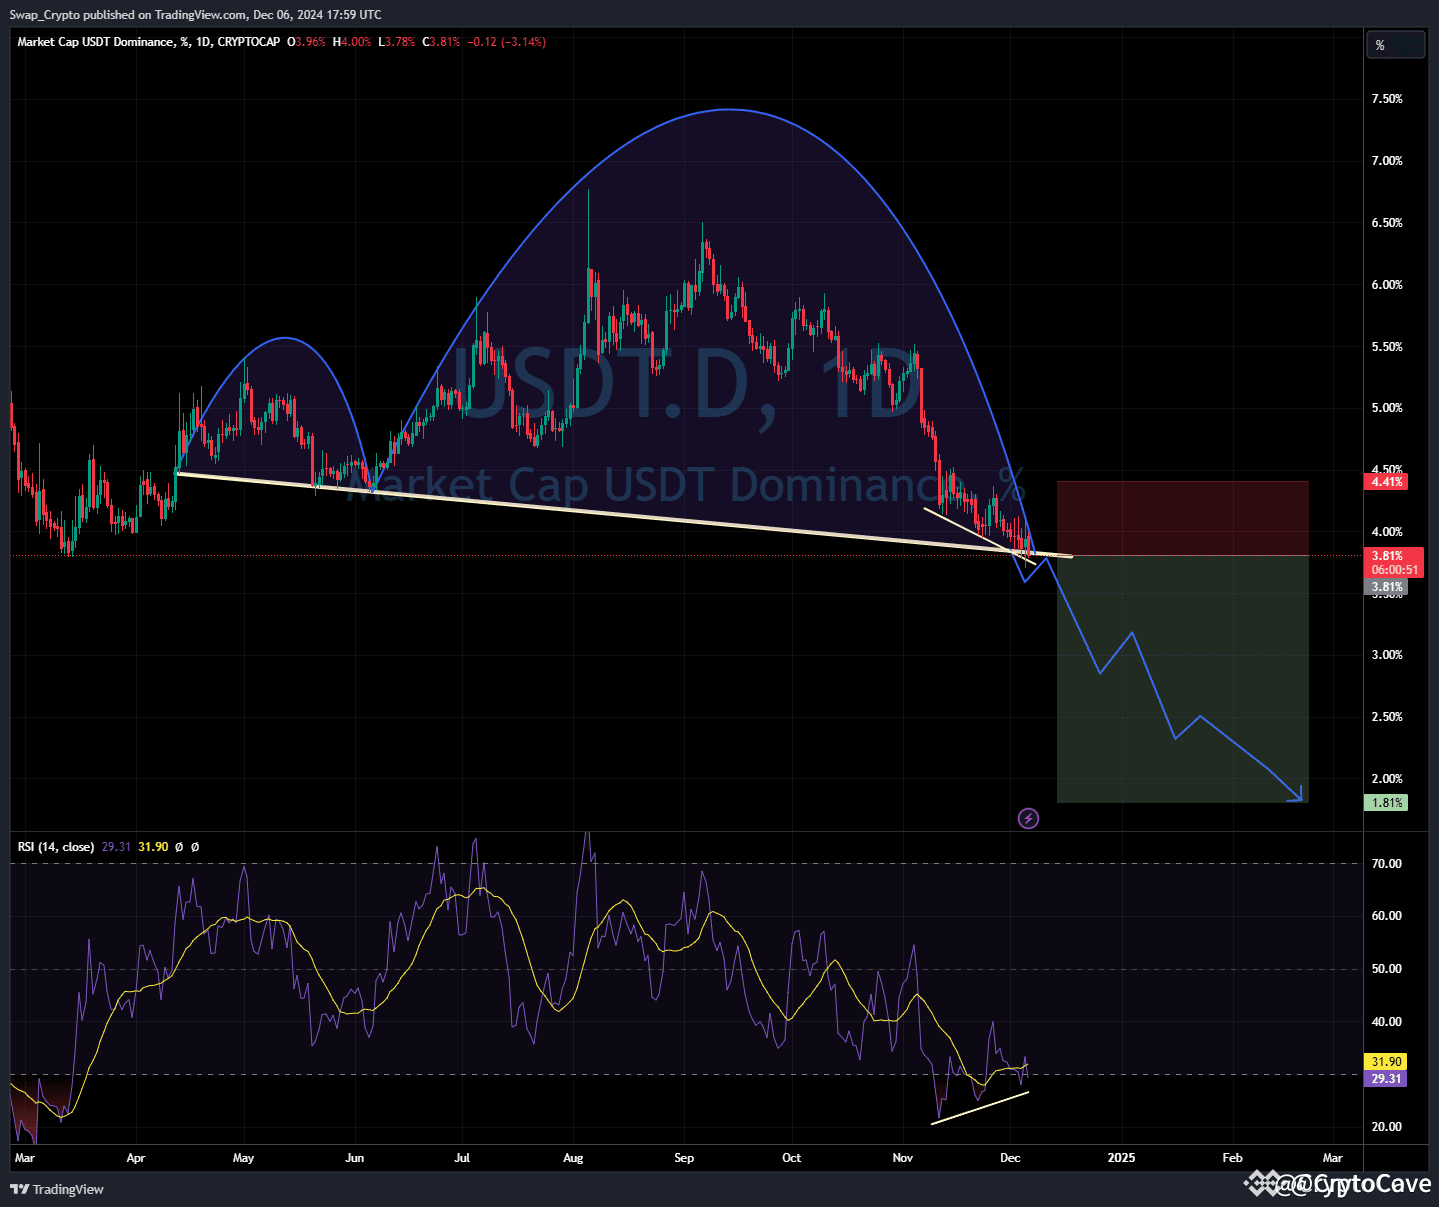 USDT.D CHART
This heatmap chart indicates concentrated liquidation zones around the $105,000 level, highlighting significant resistance. However, steady price recovery and increased activity below $100,000 suggest bullish sentiment, aligning with potential Bitcoin price appreciation.
 LIQUIDATION HEATMAP CHART
Entry price-98653.81
1st tp-104419.00
2nd tp-116630.64
This signal is only for spot if you want future signals just follow my channel.

