As the bullish sentiment in the cryptocurrency market continues to heat up, the price trends of Bitcoin, Ethereum and XRP have exploded. Bitcoin is approaching $100,000, XRP is at a 52-week high, and Ethereum is showing a new breakout.
As the broader market anticipates a new surge in December 2024, the first week is likely to see massive inflows. So, let’s find out the upcoming price trends of the top cryptocurrencies and find out the likelihood of the next bull run.
Bitcoin price target: $100,000
On the 1-hour chart, the BTC price trend showed a restorative rebound, breaking through the trend line, breaking through the long-term bearish influence, breaking through the $97,600 mark, and approaching the $99,000 mark.
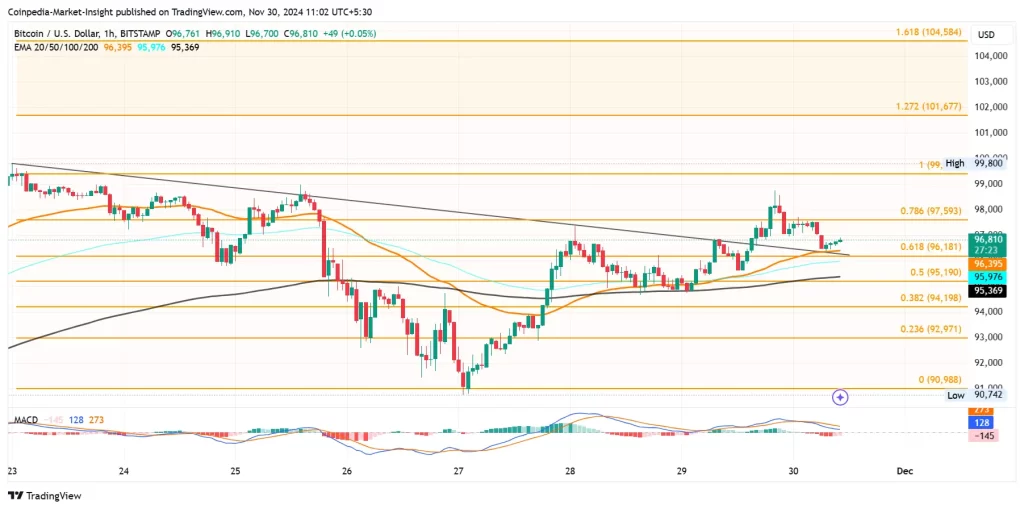
However, higher price rejection resulted in a quick retest of the breakout trendline. Currently, Bitcoin is trading at $96,395. BTC found support at the 50-EMA on the 1-hour chart and is currently undergoing an aggressive test reversal.
The bullish recovery has resulted in a golden crossover and positive alignment of the 50, 100, and 200-EMAs on the 1-hour chart. A positive crossover is imminent on the MACD and signal lines as the post-retest reversal momentum gains momentum with four consecutive bullish candles.
According to the Fibonacci levels, a retest followed by a reversal to maintain dominance above the 78.6% Fibonacci level could see a breakout above the $100,000 mark in the first week of December.
Moreover, the price trend could reach a peak of $104,584 by the end of next week. On the other hand, consolidation at the $96,000 mark could lead to a bearish outcome and reach the $95,000 support level.
Will Ethereum (ETH) Price Break $4,000?
Ethereum price trend is showing a rising wedge pattern on the 4-hour chart. Ethereum price trend is approaching a bottleneck as the upward trend of higher highs and lower lows faces a large supply from the local resistance trendline.

Currently, the stock is analyzing the overhead trendline and is trading at $3,667. In support of the upside move, despite being in a consolidation range, the MACD and signal lines are merging and are likely to regain positive alignment.
A bullish breakout would bring $4,037 and $4,300 into play as potential price targets for next week. On the other hand, the key support remains at $3,298.
XRP Price Target: $2
XRP price trend shows second bullish flag breakout rally. XRP price is slowly approaching the $2 mark as a series of bullish candles present a parabolic rebound.

Currently, the stock is trading at $1.886 with a 24-hour high of $1.90. The MACD and signal lines have seen a positive crossover with a large number of gradually gaining bullish histograms.
According to the pivot level, the immediate price resistance is $1.95. However, based on the trend momentum and the bullish rally in the bull market, the XRP price could reach $2.586 by the end of next week. The minimum support for the next week is estimated at $1.69 or $1.37.