November 4, 2024 BTC trend analysis (technical aspect) The news-related events are just temporary impacts and will not affect the overall trend. Regarding the election, whether Trump or Harris wins will not affect $BTC the ongoing upward trend! If Trump wins, it will surge first and then drop, and continue to surge; if Harris wins, it will drop first and then surge, but it’s just a matter of extended timing. Therefore, if the pullback reaches the lower boundary of the central area you are targeting, be bold and buy.
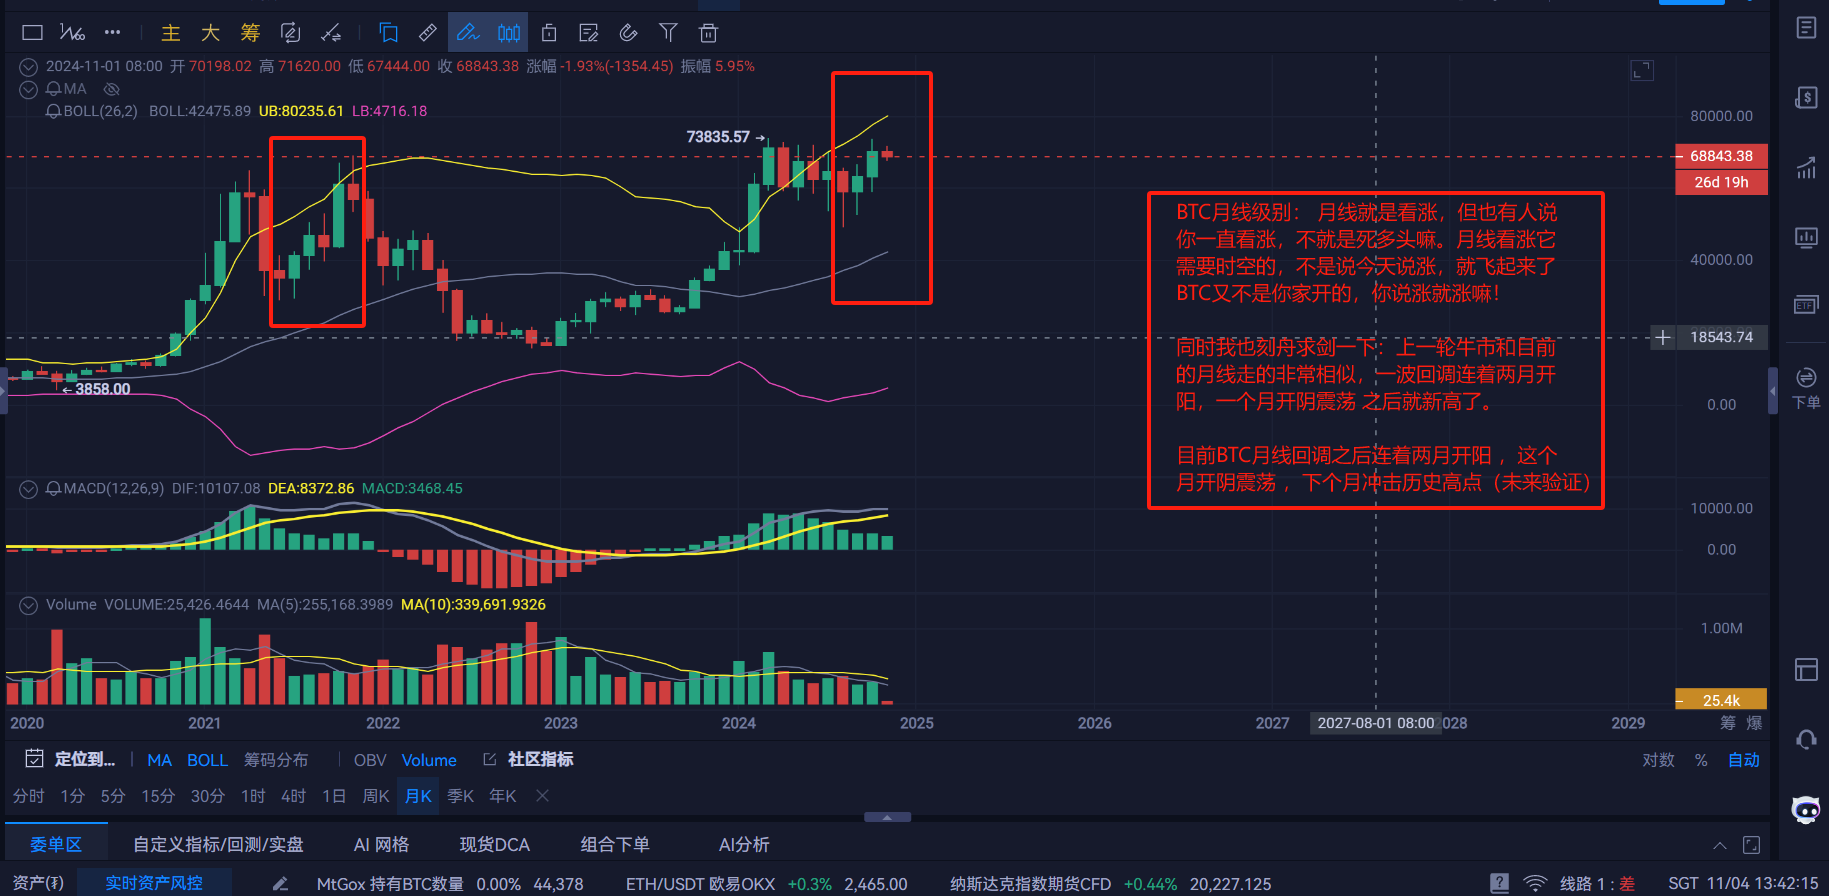
BTC monthly level: The monthly level is bullish, but some say that if you keep being bullish on the BTC monthly level, you are just a dead bull. The bullish outlook for the monthly chart requires time and space; it’s not like saying it will rise today and then it just takes off. BTC is not something you can control; it won't just rise because you say so!
At the same time, I also want to point out: the last bull market and the current monthly chart are very similar, experiencing a wave of pullback followed by two months of bullish candlesticks, one month of bearish candlestick oscillation, and then reaching new highs.
Currently, after the BTC monthly pullback, it has two consecutive months of bullish candlesticks, this month is a bearish candlestick oscillation, and next month will challenge the historical high (to be verified in the future).
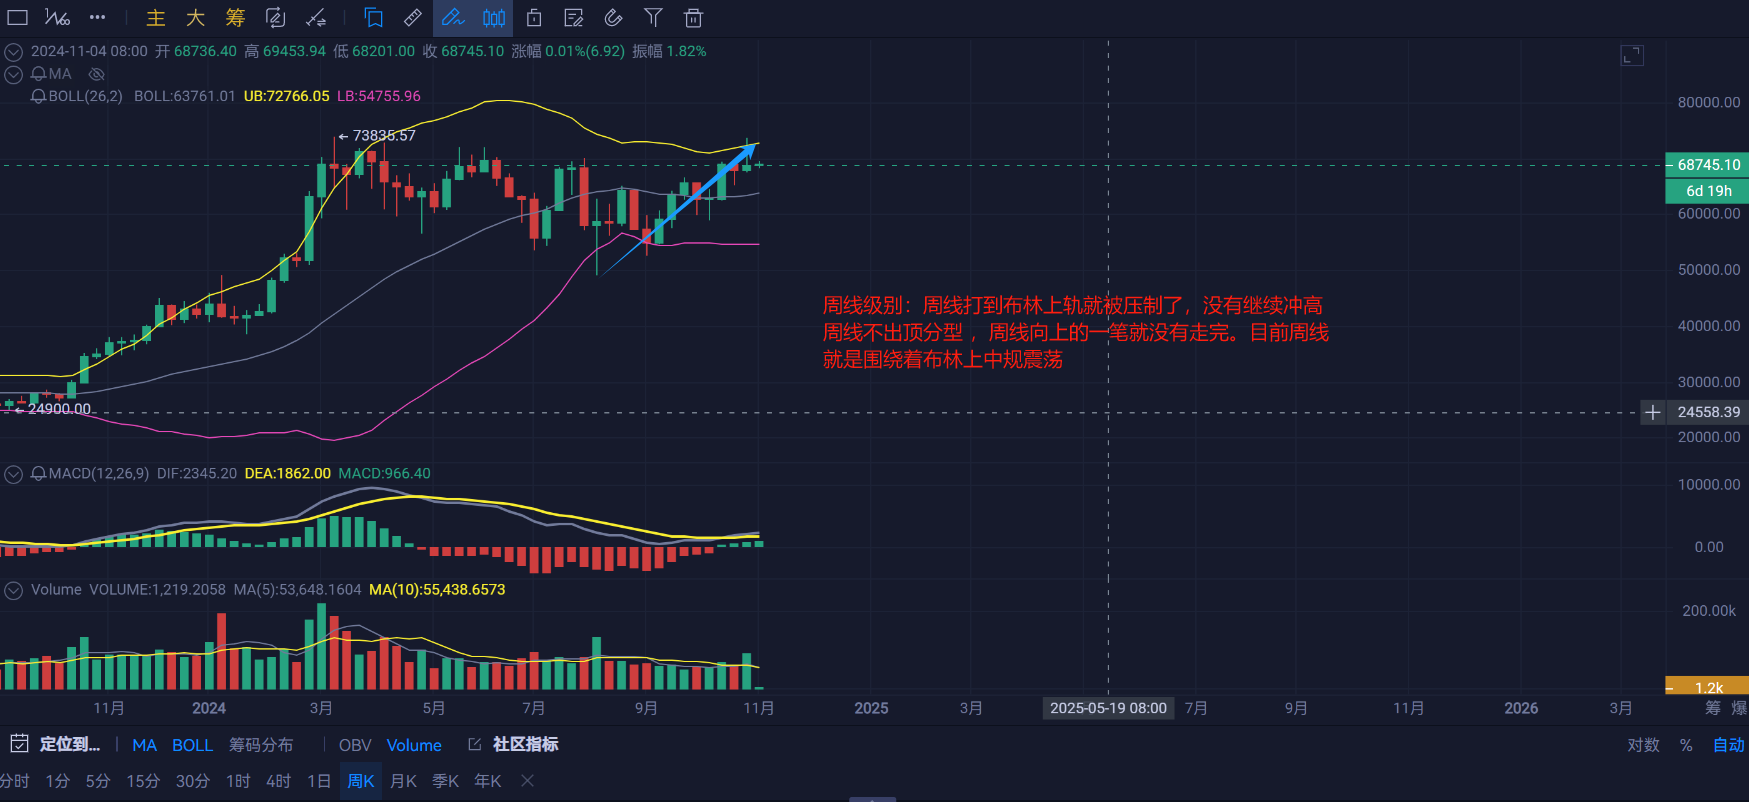
$BTC Weekly level: The weekly chart hit the upper Bollinger band and was suppressed, without continuing to push higher. The weekly chart has not formed a top divergence, and the upward segment in the weekly chart is not yet complete. Currently, the weekly chart is oscillating around the middle of the Bollinger band.
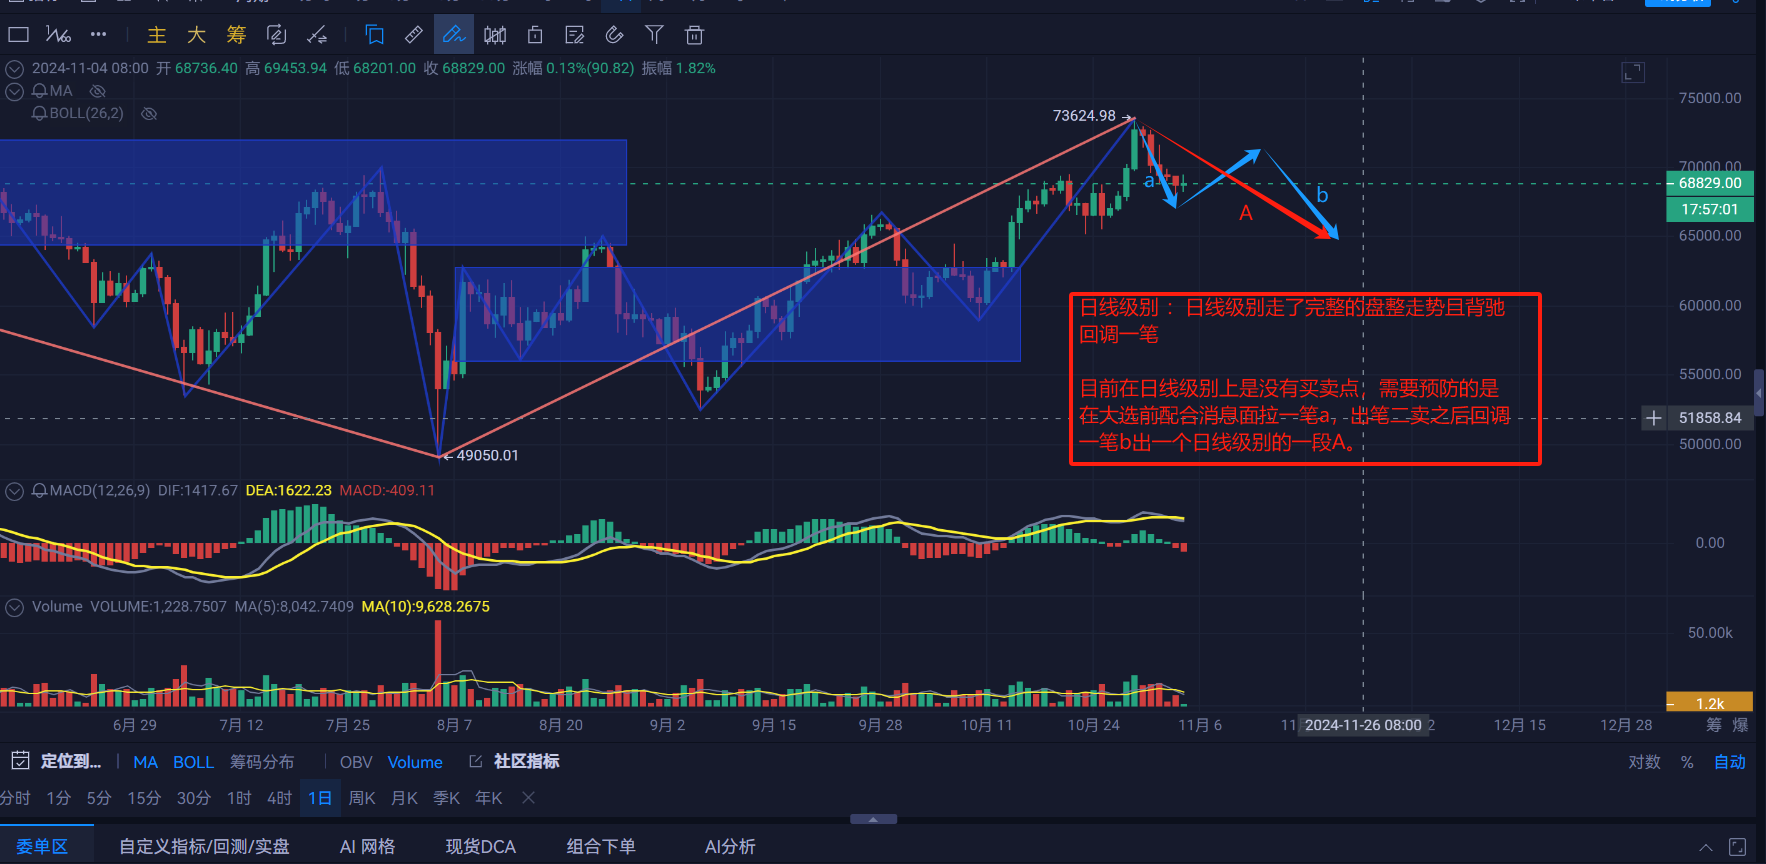
BTC daily level: The daily level has completed a full consolidation trend and has a divergence pullback.
Currently, there are no buy or sell points on the daily level. What needs to be anticipated is that before the election, there may be a pullback associated with news to form a segment A after a double sell.
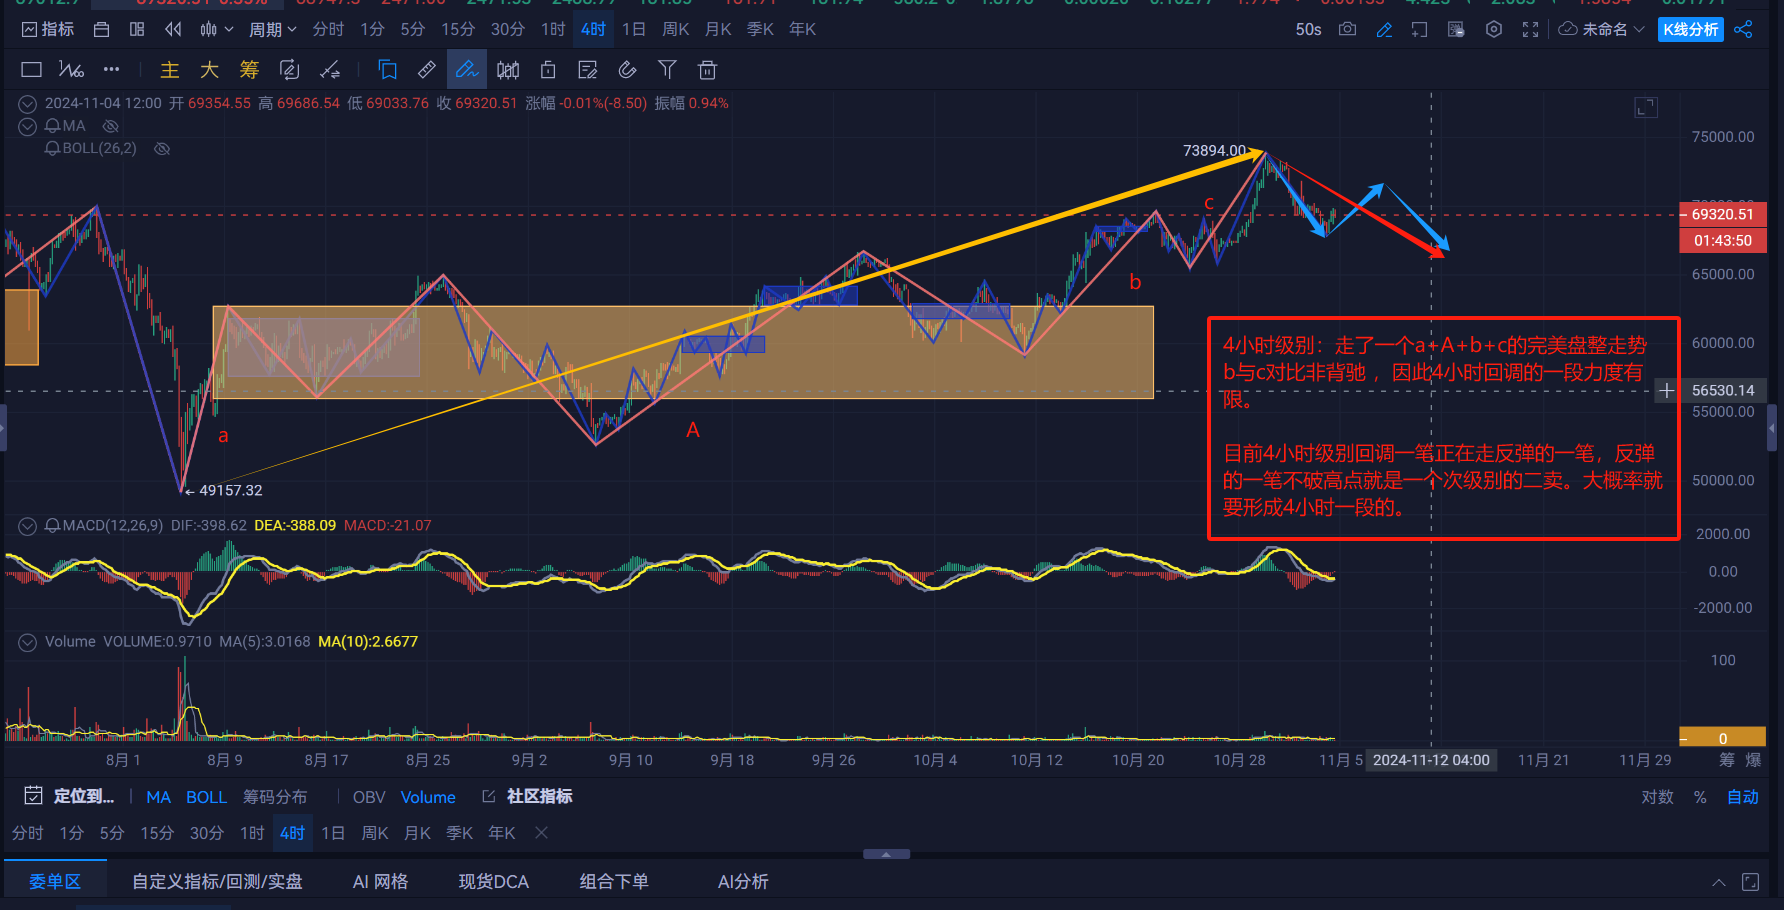
4-hour level: It has completed a perfect consolidation trend of a+A+b+c, where b and c are not diverging. Therefore, the strength of the pullback in the 4-hour segment is limited.
Currently, the 4-hour level is experiencing a pullback and is in the process of a rebound. If the rebound does not break the high point, it will be a secondary level double sell. It is highly likely to form a 4-hour segment.
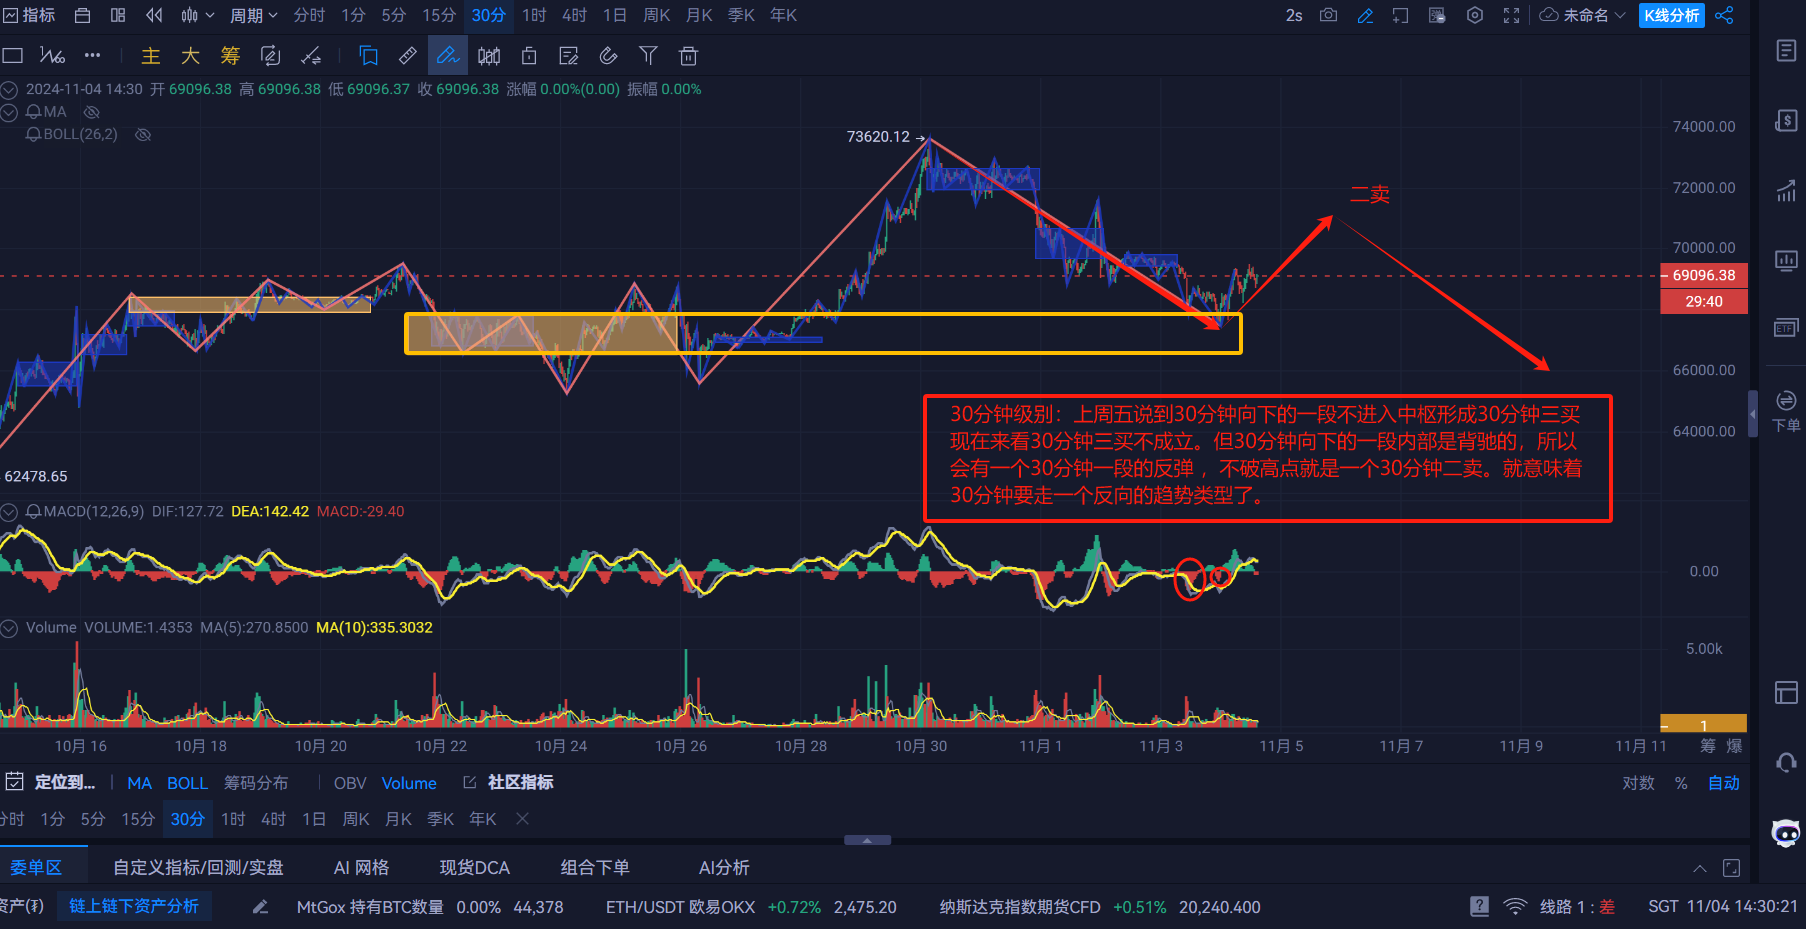
$BTC 30-minute level: Last Friday mentioned that the downward segment in the 30-minute chart does not enter the central area to form a 30-minute triple buy. Currently, the 30-minute triple buy is not established. However, the internal segment going down in the 30-minute chart shows divergence, so there will be a rebound in the 30-minute segment. If it does not break the high point, it will be a 30-minute double sell. This means that the 30-minute chart will shift to a reverse trend type.