Bears attempted to pull Bitcoin below the 20-day exponential moving average (EMA) at $66,201 on October 25, but bulls maintained their position. This indicates that market sentiment remains positive and investors are taking advantage of buying opportunities when prices drop.
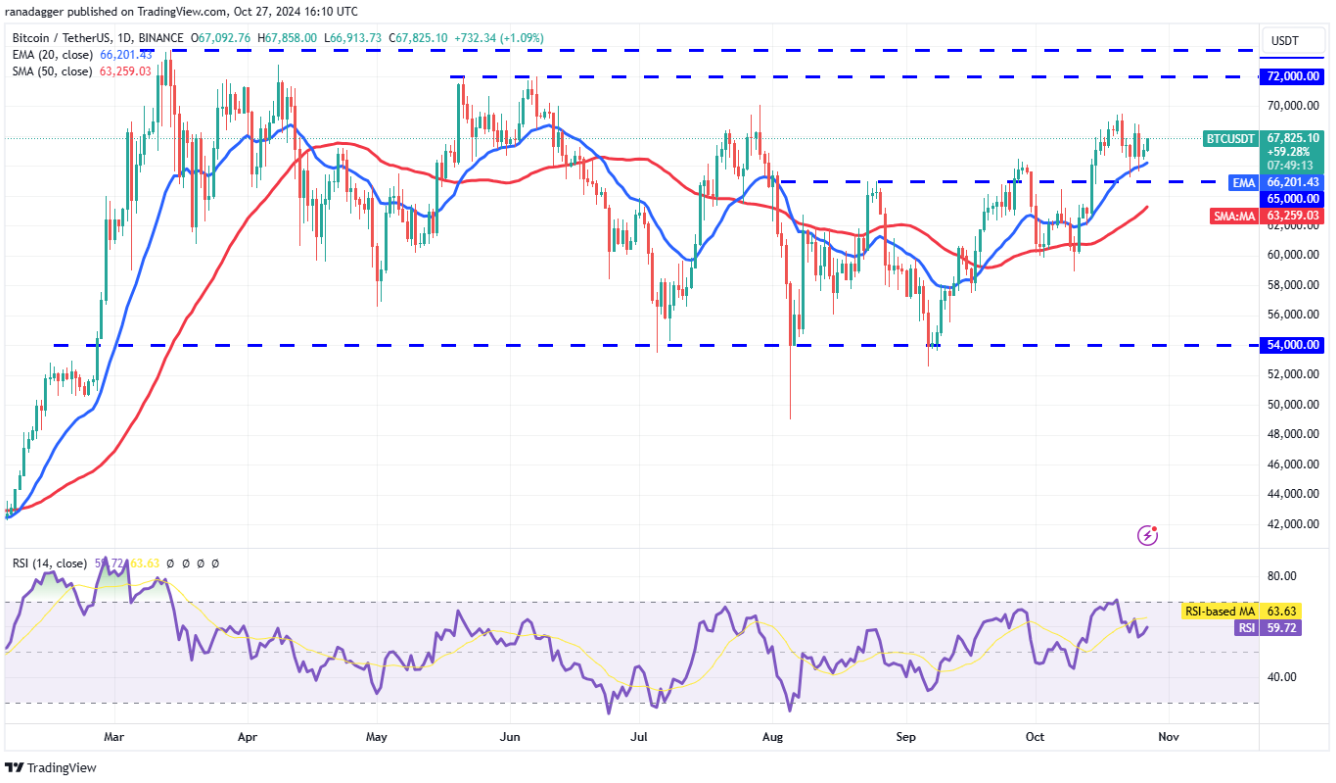
Daily BTC/USDT chart | Source: TradingView
Buyers will need to push the price above $69,550 to signal a new rally, aiming for the top of the range at $73,777. The resistance at $70,000 may be broken, and the BTC/USDT pair could reach $72,000, where bulls may encounter strong resistance from bears.
In a downward trend, bears will gain an advantage if the price breaks and closes below $65,000. At that point, the price could slide down to the 50-day simple moving average (SMA) at $63,259 and then to the important support level at $60,000.

BTC/USDT 4-hour chart | Source: TradingView
The 4-hour chart shows that moving averages have flattened, while the relative strength index (RSI) is just above average, indicating a balance between supply and demand.
Buyers need to push the price above the downtrend line to signal strength. At that point, the price could rise to $70,000. Conversely, if the price breaks and closes below $66,500, the advantage will shift to the bears, causing the price to potentially drop to $65,000 – an important level to watch. If this level is breached, the price could drop to $62,000.
#BinanceTurns7 #MarketDownturn #write2win #btc #Write&Earn $BTC