#stablecoin#USDT#USDC #BUSD
In the previous article "Tracking Long-term Trends through Stablecoin Supply", we tried to use the MACD indicator of USDT supply to observe the intrinsic momentum of the capital side. At present, the effect is more representative than the "monthly average month-on-month bar chart" used before. So starting from this week, I will use this new indicator to track the data.
Data meaning:
1. Histogram value <0: represents that the MACD line is less than the signal line, indicating a long-term bearish trend
2. Histogram value > 0: It means that the MACD line is greater than the signal line, which is a long-term positive trend.
3. Dark color of histogram: represents a decrease in the value of the histogram compared with the previous month, indicating a short-term bearish trend
4. Light color of histogram: represents the month-on-month growth of the histogram value, which is a positive trend in the short term
Tracking period: Update the data of the previous 7 days every Tuesday
Last week's data:
Figure 1: USDT supply histogram, long-term bearish trend + short-term bullish trend
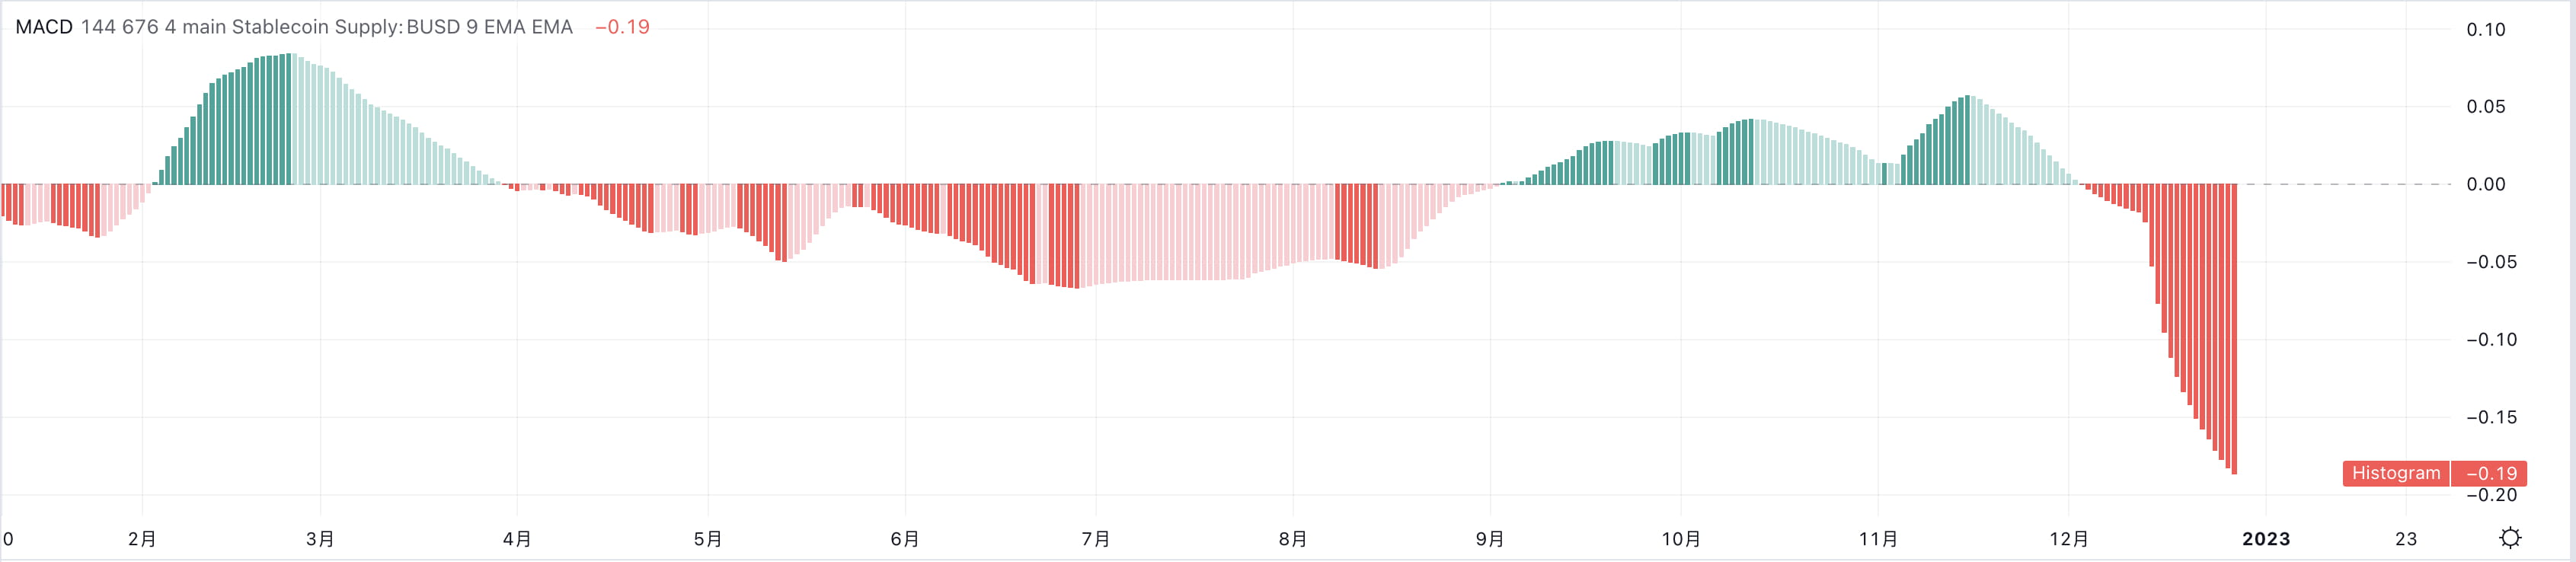
Figure 2: BUSD supply histogram, long-term bearish trend + short-term bearish trend
Figure 3 below: The total supply histogram of USDT+BUSD can represent the momentum of the main trading funds in the market. The sum of the two can also avoid the influence of the rise and fall of a single stablecoin on the judgment of the trend. This figure is currently in a long-term bearish trend + short-term bearish trend


Mcap/TVL
Mcap/TVL is the ratio of the total market value of stablecoins to TVL, which reflects the utilization rate of funds of stablecoins on the chain.
The higher the utilization rate, the smaller the Mcap/TVL ratio, which means that the market sentiment tends to be optimistic;
The lower the utilization rate, the larger the Mcap/TVL ratio, which means that market sentiment tends to be pessimistic.
Mcap/TVL current value (December 26): 2.4, tends to be pessimistic, week-on-week increase: -0.41%

From the supply histogram, we can see that the current mainstream stablecoins are still in a bearish trend. Combined with the recent weakening of Christmas trading volume, the volatility of Mcap/TVL is very small, and the overall market is in a deep bear pessimism.