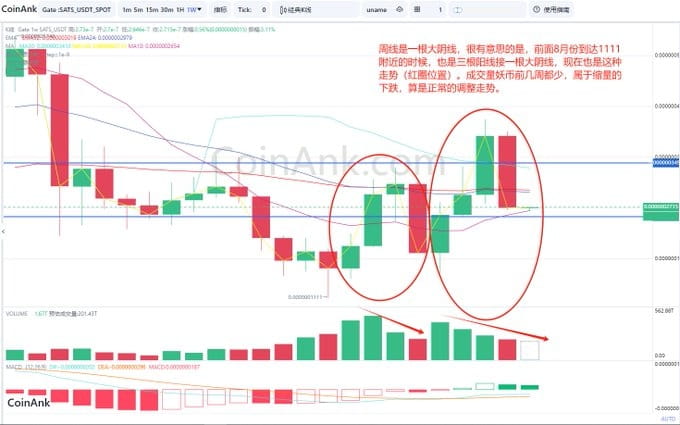
#brc20行情 Inscription
#sats(SATS) #1000sats The weekly chart is a big negative line. What is interesting is that when it reached around 1111 in August, there were also three positive lines followed by a big negative line. This trend is also the case now (red circle position). The trading volume was small in the past few weeks, which is a decline in shrinking volume, which is a normal adjustment trend.
The daily line is a big negative line, the price fell below the daily MA30 line and EMA52 line, and MACD showed a trend of increasing downward momentum above the zero axis. If MACD returns to the zero axis, it will take three days at the fastest and 7-10 days at the slowest. So there is still adjustment at the daily level, but it is also easy to pull it back with one or two big positive lines and quickly end the adjustment process. So if the price can return to the 2264-2540 range, you should boldly get on board

At the hourly level, the 2-hour pullback is effective and the new low has not appeared. There is no divergence pattern. If it pulls back to the 2-hour EMA52 line, there will be a downward trend. You can short at 2870 and 2980
