#stablecoin#stablecoin#USDT
This article tracks the long-term trend by observing the supply rate of the stablecoin USDT and matching the utilization rate of the stablecoin on the chain.
We know that the supply of stablecoins determines the supply of funds in the crypto market. The greater the supply, the more abundant the funds, and vice versa. But if you only look at the supply, you will inevitably fall into a question: Why is the overall supply in this year's bear market not large, but the price has been falling? Is there no correlation between stablecoin supply and price movements?
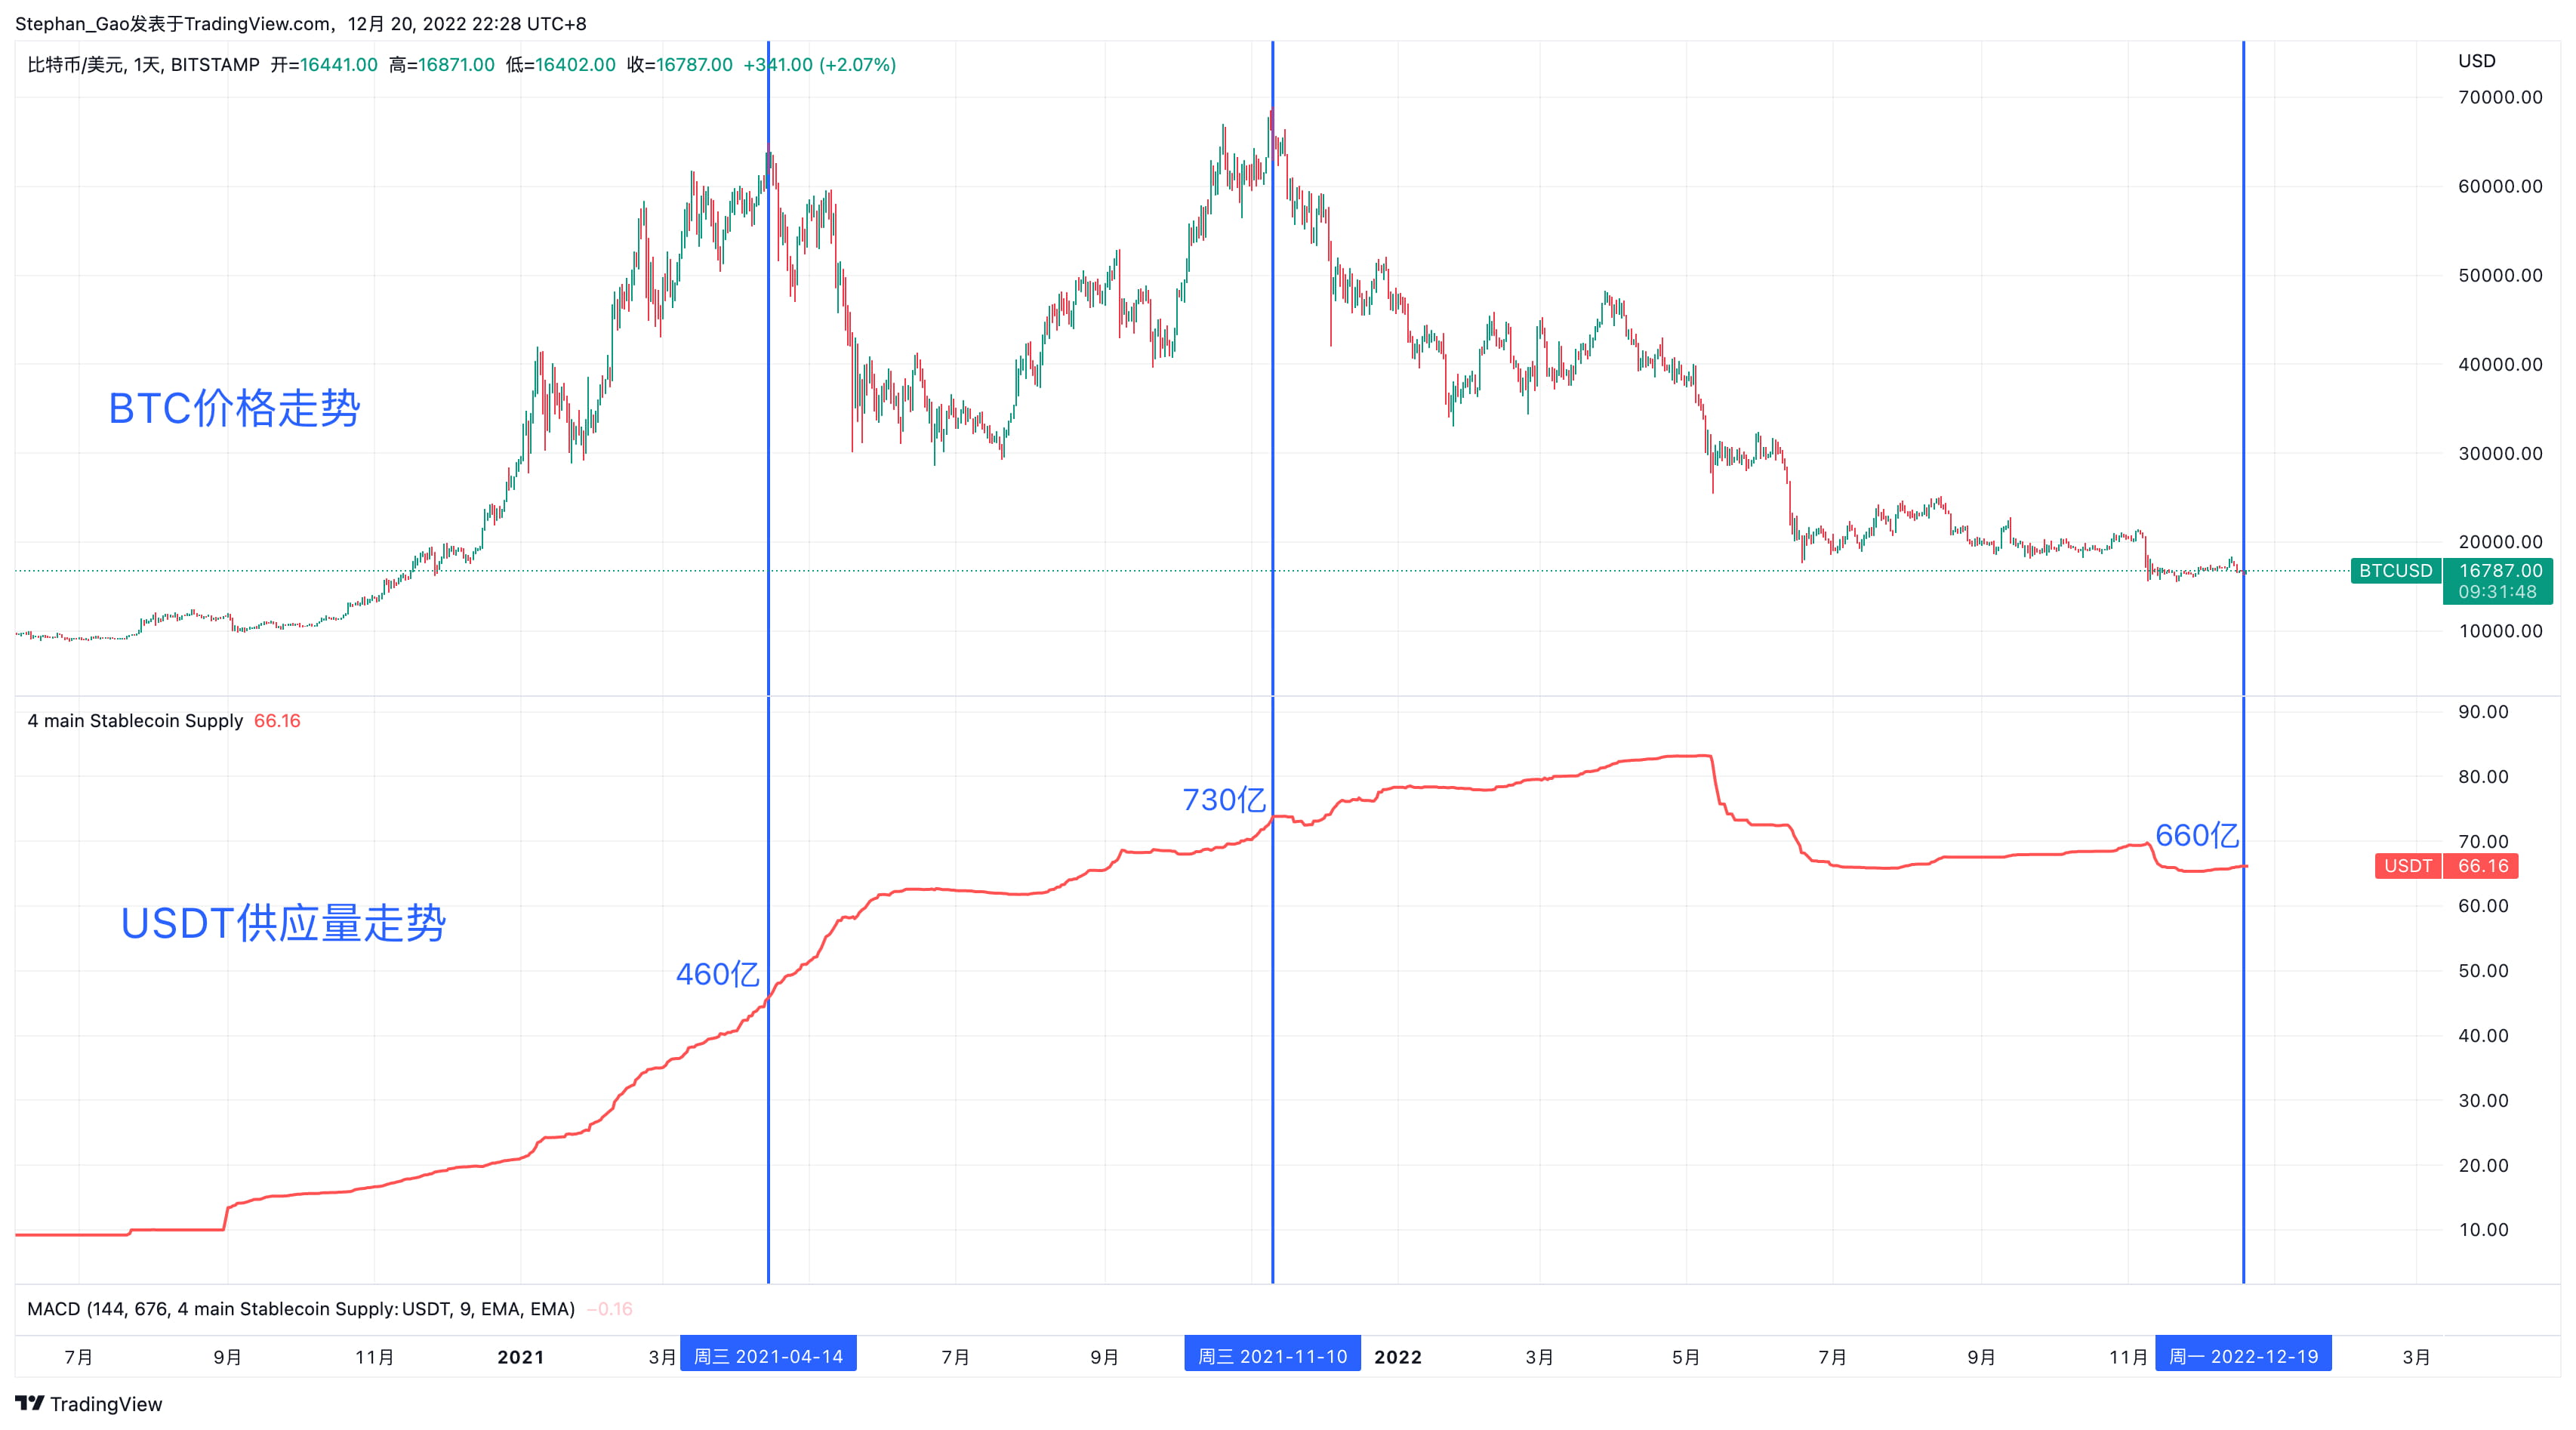 上图中可以看到,2021年BTC双顶时的USDT供应量分别为460亿和730亿,而当前的USDT供应量为660亿,看起来相比去年双顶时的供应量也不算少。带着这个疑问,我们尝试引入稳定币的供应速率,来观察它和价格走势的关系。
Stablecoin supply rate
We know that the MACD indicator can be used to measure the intrinsic kinetic energy of the K line. When the MACD line is higher than the signal line, the difference is positive. The larger the value, the faster the MACD line is. When the MACD line is lower than the signal line, the difference is negative. Smaller values represent a slower MACD line.
Then, we can use the supply of USDT as a benchmark indicator and add a MACD indicator to it to observe the supply rate of USDT. Since what I want to observe here is the long-term trend, the MACD fast line is set to EMA 144, the slow line is EMA 676, and the signal line is the default value 9:
 上图可以看到,在牛市大部分时候,MACD>信号线(绿色部分),值越大代表USDT流入速度越快;在熊市大部分时候,MACD<信号线(红色部分),值越小代表USDT流出速度越快。
If you zoom in on the bull-bear transition period, you can see that the dead cross formed three times on 2021-10-04, 2021-11-23, and 2022-01-12:
 这说明牛熊转换期间,USDT的供应速度在减慢。如果以此信号分批卖出,可以起到不错的逃顶效果。
Before the sharp drop on 2020-03-12, this indicator also showed a dead cross signal:

The internal logic of this indicator is: in the long run, regardless of whether the price is still rising, as long as the supply of funds slows down, the fundamental support for the price will also weaken, which may lead to a turning point in the future trend.
However, it is of course too risky to use a single indicator to make investment decisions, so we introduce the on-chain utilization of stablecoins to assist observation.
Stablecoin on-chain utilization (Mcap/TVL)
If you have been watching my recommendations for a long time, you may be familiar with this indicator. The description of this indicator is as follows:
Mcap/TVL is the ratio of the total market value of stablecoins to TVL, which reflects the capital utilization of stablecoins on the chain.
The higher the usage rate, the smaller the Mcap/TVL ratio is, indicating that market sentiment tends to be optimistic;
The lower the usage rate, the greater the Mcap/TVL ratio, which means that market sentiment tends to be pessimistic.
 上图可以看出,在2021-12-02,TVL达到最大值1598亿,同时Mcap/TVL也达到最小值0.53,之后随着TVL一路走低,虽然稳定币Mcap还在升高,但链上资金利用率降低,Mcap/TVL也随之拐头。
This indicator observes the market from the perspective of the on-chain capital utilization of stablecoins. When the bull-bear transition occurs, the capital utilization will also change from an upward trend to a downward trend. However, this indicator is relatively lagging, and I personally think it is suitable as an auxiliary confirmation indicator of the stablecoin supply rate MACD indicator.
