
Today we will continue the market analysis. Although market analysis is easy to be slapped in the face, because short-term predictions are almost impossible to be 100% accurate, after all, we are not gods, so this time we will predict the next market from another perspective. When we talked about market analysis last time (Market analysis. Market crash, Bitcoin and Ethereum circuit breaker? 24 hours liquidation of 1 billion US dollars, the US economy is heading for recession?), we benchmarked the US stock market, so this time we will judge the trend of encryption from the trend analysis of the US stock market. We all know that the trend of encryption is very similar to that of the US stock market, because the old US is actually more open, and there are many people speculating in cryptocurrencies. According to the data of Coincodex, there should be about 30 million people speculating in cryptocurrencies in the United States, accounting for about 10% of the population. The number of people speculating in cryptocurrencies worldwide is between 400 million and 500 million (2023 Coingeco data). If you count the people speculating in US stocks, 61% of people in the United States alone copy US stocks, and there are even more people speculating in US stocks worldwide, so the trend of US stocks is related to the interests of most people, which leads to the movement of US stocks, and some related major investment products will follow the trend. Judging from the current trend, the trend of cryptocurrency is getting closer and closer to that of the U.S. stock market, especially during the last bull market, which can be said to be roughly the same. The current overall market value of Nasdaq is 25 trillion U.S. dollars, the U.S. stock market is about 58 trillion, and cryptocurrency is 2 trillion U.S. dollars, which is also a considerable size.

Correlation analysis between Bitcoin and US stocks
1. Overview of Historical Relevance:
- Early stage (2009-2016): Bitcoin had a smaller market capitalization in the early stage, and market participants were mainly technology enthusiasts and small-scale investors. At this time, Bitcoin had a lower correlation with US stocks because it was more regarded as an alternative investment asset and was not closely linked to traditional financial markets.
- 2017-2018: As the price of Bitcoin rose rapidly, more and more institutional investors began to pay attention to Bitcoin. During this period, as Bitcoin became more popular, especially when the market was volatile in 2018, people found that the correlation between Bitcoin and US stocks began to increase.
- After 2020: The outbreak of the new crown epidemic has caused violent fluctuations in global markets, and central banks such as the Federal Reserve have adopted large-scale monetary easing policies. This has made Bitcoin increasingly regarded as a "digital gold" or anti-inflation asset. Bitcoin's correlation with U.S. stocks has increased significantly in 2020 and 2021, especially when market panic or risk appetite increases.
2. Factors affecting relevance:
- Global macroeconomic environment: When global market uncertainty increases, such as economic recession, financial crisis, etc., Bitcoin and U.S. stocks tend to show a higher correlation because investors tend to sell risky assets at the same time.
- Institutional investor participation: As more institutional investors enter the Bitcoin market, their investment strategies may be similar to those in the stock market, thereby increasing the correlation between Bitcoin and U.S. stocks.
- Liquidity and market sentiment: Increased liquidity of Bitcoin and changes in market sentiment (such as concerns about inflation) can also affect its correlation with U.S. stocks.
3. Current Situation:
The correlation between Bitcoin and U.S. stocks may be affected by market sentiment and global economic events in the short term, but in the long term, the correlation between the two may decrease, especially as Bitcoin is gradually viewed as an independent asset class and its market capitalization and market participants further diversify.
Specific trend analysis
Big Pie K-line

Nasdaq K-line

S&P 500 K line

Bitcoin started to rise from March 2020 to November 21, and then fell to the bottom range in November 22.
In the last bull market, the Nasdaq started to rise in May of 2020, reached its peak in November of 21, and then fell to the bottom in October-December of 22.
The last bull market of the S&P 500 started to rise in March 2020, reaching its peak in January of 22, then began to fall until October of 22, and continued to rise.
Bitcoin has recently diverged from the US stock market
Recently, the trend of BTC and the Nasdaq Index of US stocks has diverged. The Nasdaq has continued to set new highs while BTC has fallen and led to a significant decline in the overall crypto market. This is inconsistent with the traditional impression that the Nasdaq and BTC are positively correlated.
In fact, BTC and US stocks do not always have a fixed coefficient positive correlation, but have different correlations at different stages of the cycle. Looking back at the last bull market and the current bull market, we can find several rules:
The initial starting point and final end point of the two increases are exactly the same in terms of time, but the process of their increase is different.
The Nasdaq's rise is relatively stable, and the K-line shows a straight line with an approximately fixed slope.
BTC is different. Its rising process is closer to exponential growth. The initial rising rate is relatively slow, and then it rises rapidly after a certain point in time. Coincidentally, the "turning point" of this accelerated rise corresponds to the first pullback and stabilization of the Nasdaq in the rising stage.
At the same time, the first peak of BTC corresponds to the second small pullback platform in the rising stage of Nasdaq.
Is there any trace of the current situation of the US stock market rising and BTC falling? It can be found that in most of the two bull markets, BTC and US stocks maintained a positive correlation, and negative correlation stages appeared but were not dominant. In the last bull market, after BTC peaked for the first time, the Nasdaq continued to rise, but BTC pulled back, and the two trends diverged, which is similar to the current market situation. History has repeated itself in the same place again.
How will the market trend go in the future? How long will the divergence between BTC and Nasdaq last? How will the divergence be resolved? From the perspective of time and strength: 1. In the last bull market, the divergence between the two did not last long. On the weekly chart, it lasted for about 9 weeks, and then returned to a positive correlation (weekly level).
S&P 500 K-line

The maximum decline of the S&P 500 in this wave was from 5660 to 5100, with a maximum decline of 9%. It has now reached 5600, which is almost close to the previous high.
Nasdaq K-line
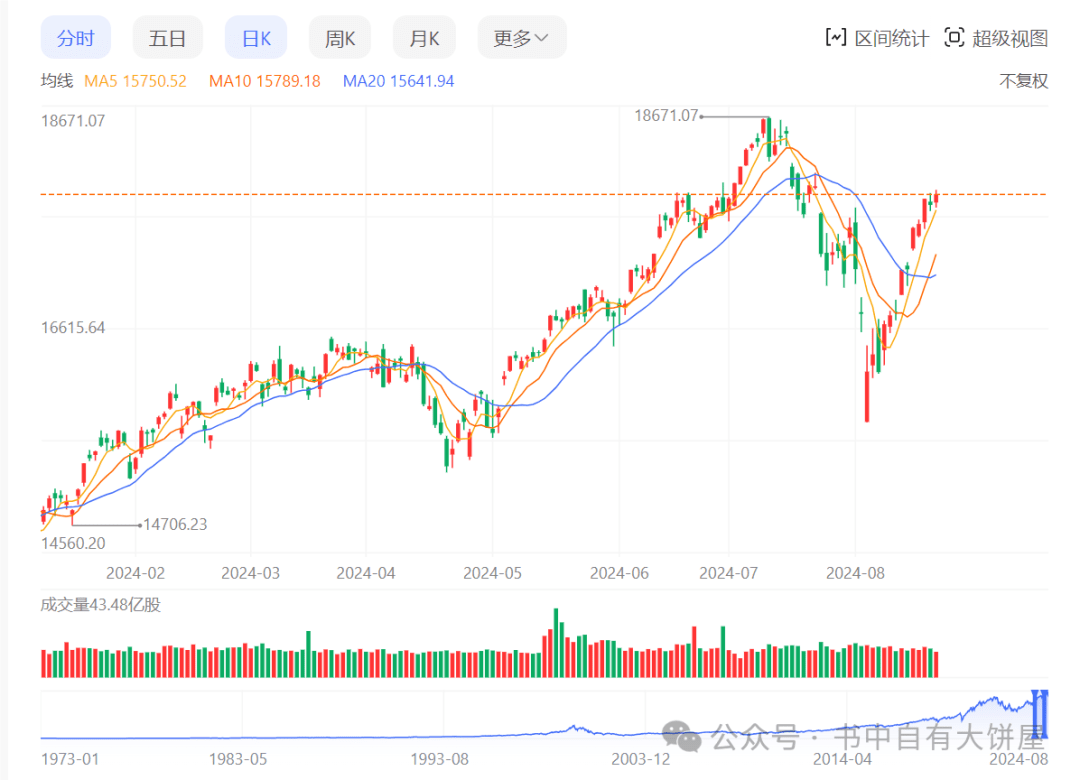
The maximum decline of the S&P 500 in this wave was from 5660 to 5100, with a maximum decline of 9%. It has now reached 5600, which is almost close to the previous high.
Bitcoin K-line
As for the trend of cryptocurrencies, after reaching its highest point in March, each wave of decline has been hitting new lows. It is currently trading sideways at around 60,000, and there is still a big gap from the high of 73,000. If the 49,000 on August 5 is included, the maximum decline has exceeded 30%. This is already a greater retracement than the U.S. stocks with a larger market value or the Nasdaq, which is smaller than it.
Moreover, it did not follow the trend of the U.S. stock market. The U.S. stock market has almost been rising these days, but Bitcoin did not. If the U.S. stock market rises sharply, Bitcoin may rise slightly. If the U.S. stock market rises slightly, then Bitcoin may fall or not rise. If the U.S. stock market falls slightly, then Bitcoin may fall sharply. Its overall performance is not as good as that of the U.S. stock market.
Subsequent market
So, how will the US stock market go in the future? It is actually very simple. You can see from the monthly line that the US stock market is really powerful. Whether the interest rate is raised or not, it will continue to rise. From the beginning of the rise in 22 years, every time it encounters a high point, there is actually not much resistance, and it is relatively easy to pass it. It will not come twice, so the US stock market is likely to set a new high this time. Now it is the end of August, and there is a high probability of loosening in September, so the US stock market is likely to continue to break new highs.
Then the cryptocurrencies affected by the U.S. stock market will definitely get rid of their previous downturn. Coupled with the impact of monetary easing, they should most likely see a better market trend. Many people are still waiting for the 40,000 or 30,000 yuan big cake. I think they can almost give up resistance. By the end of September at the latest, the market will definitely reverse and usher in a big bull market. We don’t have much time left to hoard coins.

