I firmly believe that reverse thinking combined with a long-term perspective will produce beneficial results in life.

The market fell for 9 days during the 9-day tourism. The market rebounded after the tourism ended, but this does not mean the beginning of a reversal. The signal of the rebound is not as strong as a reversal, but it also gave the market confidence.
If you’ve been around long enough, you’ll realize that the cryptocurrency market develops in phases, each driven by a different narrative.
We have seen the first phase led by Bitcoin, Solana, and AI-backed altcoins. However, in recent weeks, when the meme coin narrative drove the crypto bull run, the market has entered reset mode.
The concept of “buy in July, sell in November” is not new. July marked the bottom for Bitcoin during the 2020-2021 bull run, with prices rising from around $9,000 to over $68,000 in less than 11 months. See the screenshot below.

(Bitcoin hit a new high in July 2020 and then a new high in 2021)
You see, people usually take advantage of the summer holidays by taking advantage of risk assets like stocks and cryptocurrencies. This has been the case in recent years, and we’ve seen it again this year as Bitcoin has faced significant selling pressure after breaking above $73,000 in May.

The same trap happens in January 2023, September 2023, July 2022, etc. The key is to time the growth and understand the market position 10 indicators that the bull market is still before us:

Stablecoin Index ✧ This index tracks new capital entering the crypto market ✧ Currently, we are far from the levels of previous cycles ✧ Once liquidity increases, the market will grow accordingly

Volume ✧ Despite Bitcoin’s higher price, volume is much lower now compared to 2021 ✧ Retail participation is extremely low, so once retail participation increases, the market will rise

YT indicator The YT indicator is about 5 times lower than the previous cycle ✧ In 2021, when the BTC price was $70,000, the number of views per day was 4 million ✧ Now, when the BTC price is $70,000, the number of views per day is about 800,000 This shows that the interest of retail investors is still low and there is room for growth

BTC.D ✧ This chart shows BTC mc as a percentage of the total cryptocurrency market cap ✧ Since April, BTC.D has been consolidating in the 54% to 57% range ✧ Once BTC.D falls below this range, it will signal the start of the altcoin season

Coinbase App ✧ When Coinbase becomes the most downloaded app, it has historically signaled an exit ✧ This trend is likely to repeat, but is far from the case at this point

Google Trends ✧ Google Trends data shows that searches for Bitcoin, cryptocurrency or altcoins are still far below 2021 levels ✧ Evaluating global trends over the past 5 years, we find that current search interest is 2.5 times lower than in 2021

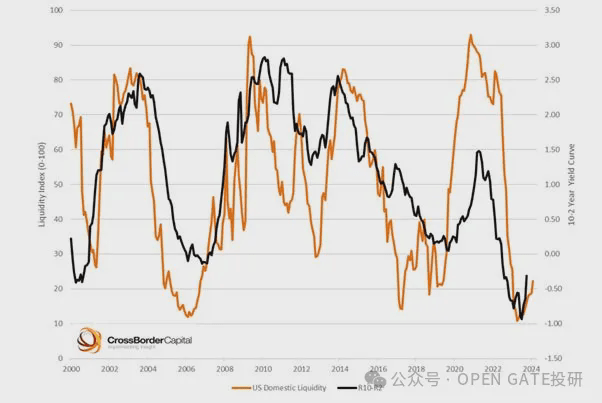
Fed Trend ✧ Chart shows that when the Fed injects liquidity: it buys assets, it increases its balance sheet and vice versa ✧ It is crucial to follow this trend because a reversal will increase liquidity in traditional financial markets and then in cryptocurrencies

Global Net Liquidity Index ✧ This indicator monitors the assets held by major central banks and the Federal Reserve ✧ Global liquidity is currently in a consolidation phase ✧ However, the chart shows that changes are coming
Venture Capital Firm Funding ✧ Venture Capital Project Funding Reflects Market Interest ✧ Funding Peak Was in 2021, Coinciding with Cycle Peak ✧ Funding Is Now Four Times Lower

OTHERS/BTC CHART ✧ OTHERS/BTC is a true reflection of altcoins ✧ And now, it’s even lower than December 2023 ✧ Major growth is just ahead ✧ Bro, if you think I’m crazy for believing this, understand that even GCR is bullish.

Good luck and see you next time!
I will be posting project research and essay updates regularly, so stay tuned for more information and to stay up to date!
