$ETH Our analysis is based on volumes. If we look at the situation in 2019. we won't find similarities, but we will see clues.

While we are under the trend resistance, the maximum volume accumulates at a certain point (red line). At the moment of a trend change, we cross this volume.

Now a similar situation has formed, we have already crossed the maximum volume and formed an upward trend:

If you look at the 1st slide, you will see that the upward trend has changed to a downward trend again. The same should be expected at the moment. Falls and trend changes.

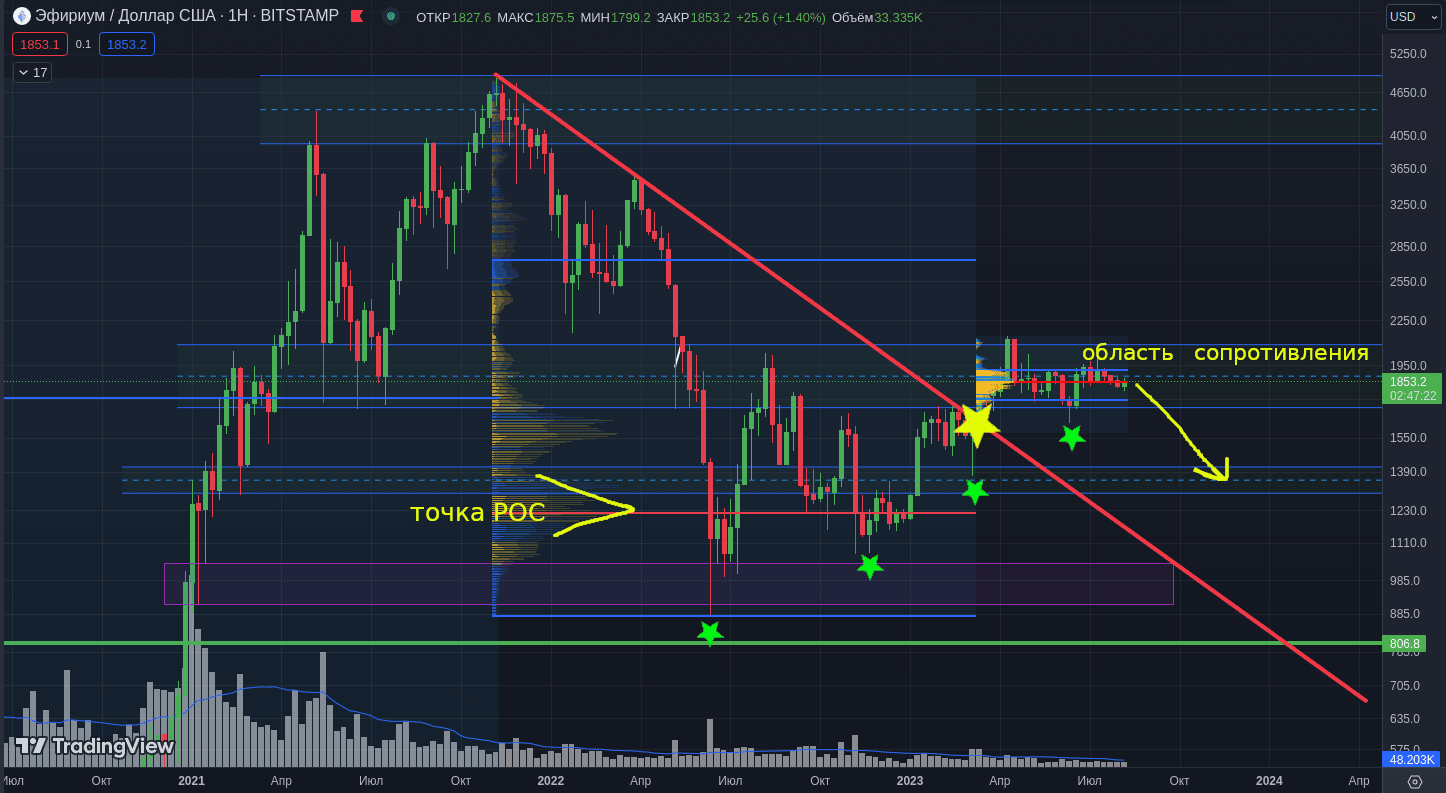
The cluster graph shows how purchases are decreasing.

From March to May there were major purchases, after which interest disappeared and the price went flat.

FORECAST: decline to the POC point formed before the bearish trend changed to an upward one

A similar situation occurred in 2019, first screen

We see that the price is even now in a flat below the POC level

#ETH #Ethereum #Crypto2023 profit to everyone, like and stop