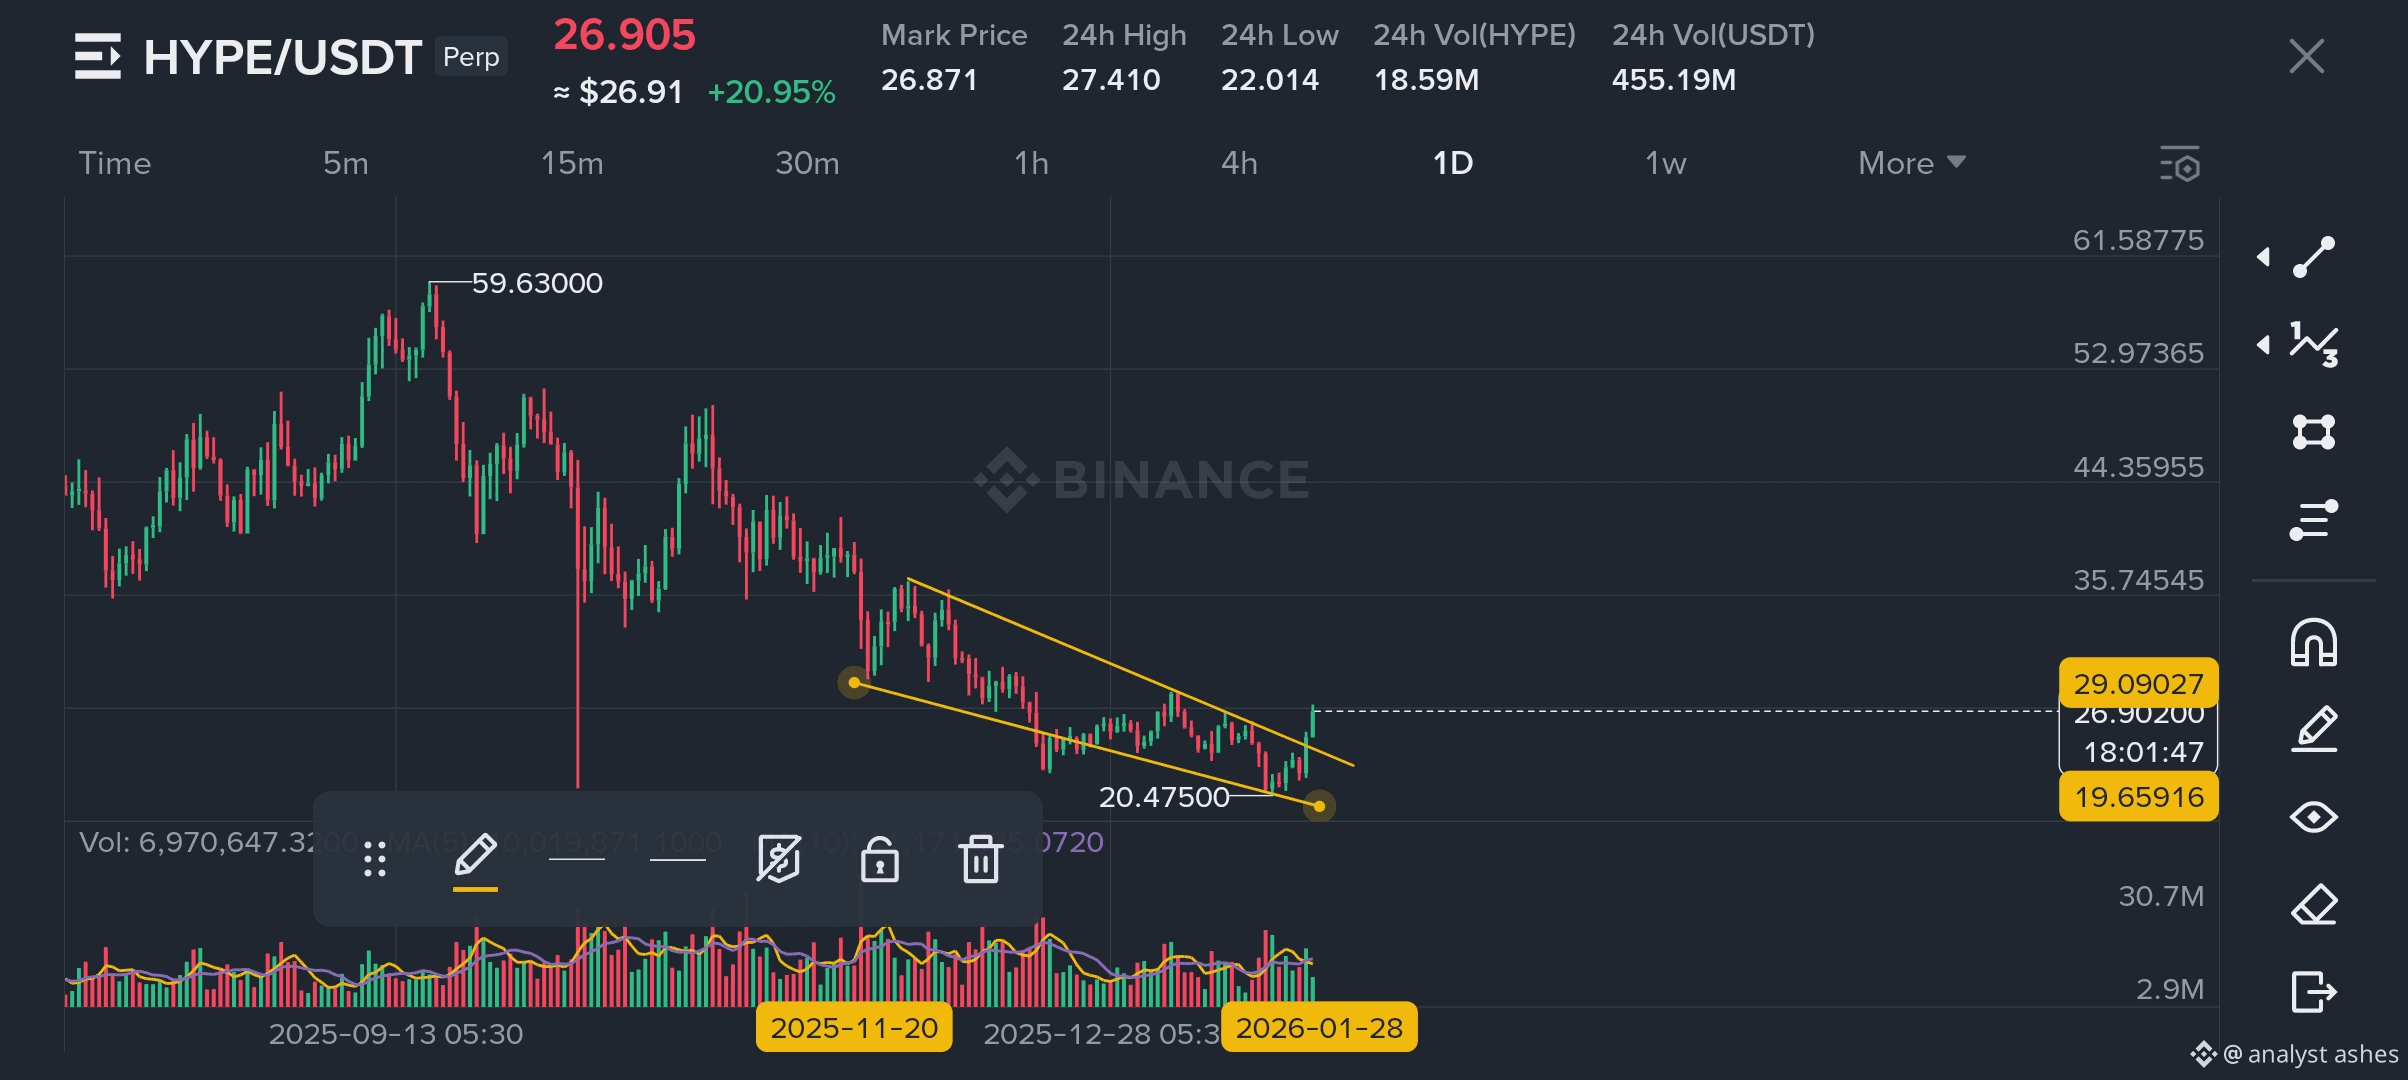
The HYPE/USDT chart shows a clear descending triangle pattern at around $26.95, signaling a bearish continuation as price tests the lower trendline amid declining highs. Current market data confirms HYPE trading near $25-47 (varying sources), with recent volatility including a 12.96% 24h gain but neutral technicals
Signal long
HYPEUSDT
Trajne ter. pog.
39
-5.44%